Fig. 4.
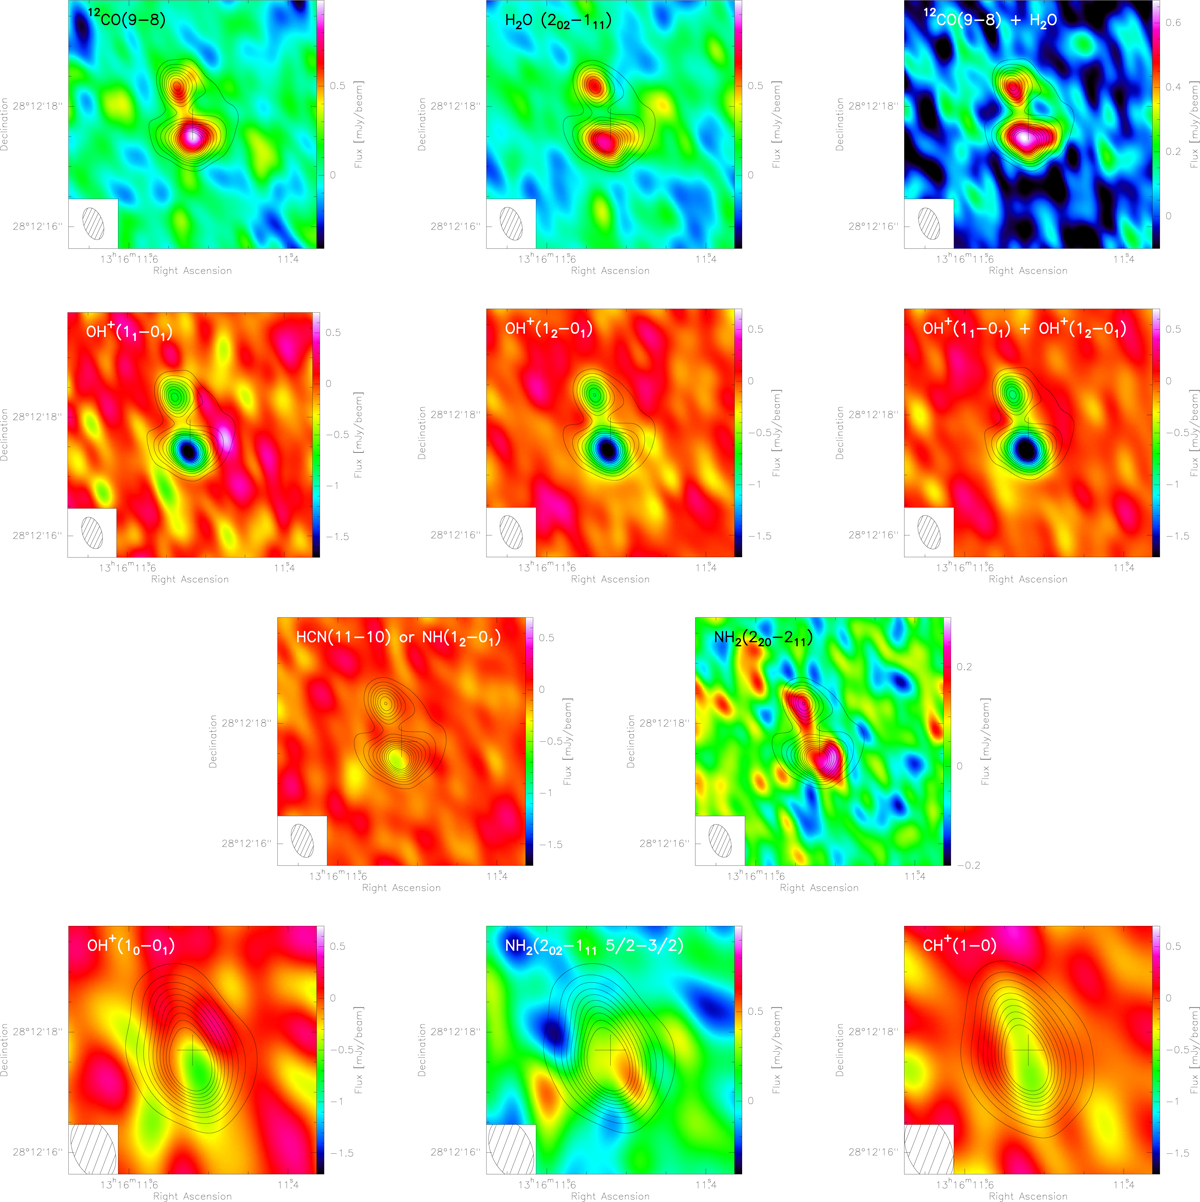
Images of the molecular emission and absorption lines detected in HerBS-89a, compared to the underlying continuum (natural weighting; shown as contours with 10σ spacing) extracted in the respective side-band where each molecular line was detected (for each image the continuum has been subtracted from the line emission). The three upper rows display the high-angular resolution data, whereas the bottom row shows the lower-angular resolution images. Upper right panel: combined 12CO(9 − 8) and H2O(202 − 111) image that enhances the low-level line emission, in particular along the western arc of the partial Einstein ring. Right panel in the second row: combined map of OH+ ((11 − 01) and (12 − 01)) absorption lines. The synthesized beam is shown in the lower left corner of each of the images.
Current usage metrics show cumulative count of Article Views (full-text article views including HTML views, PDF and ePub downloads, according to the available data) and Abstracts Views on Vision4Press platform.
Data correspond to usage on the plateform after 2015. The current usage metrics is available 48-96 hours after online publication and is updated daily on week days.
Initial download of the metrics may take a while.