Fig. 3.
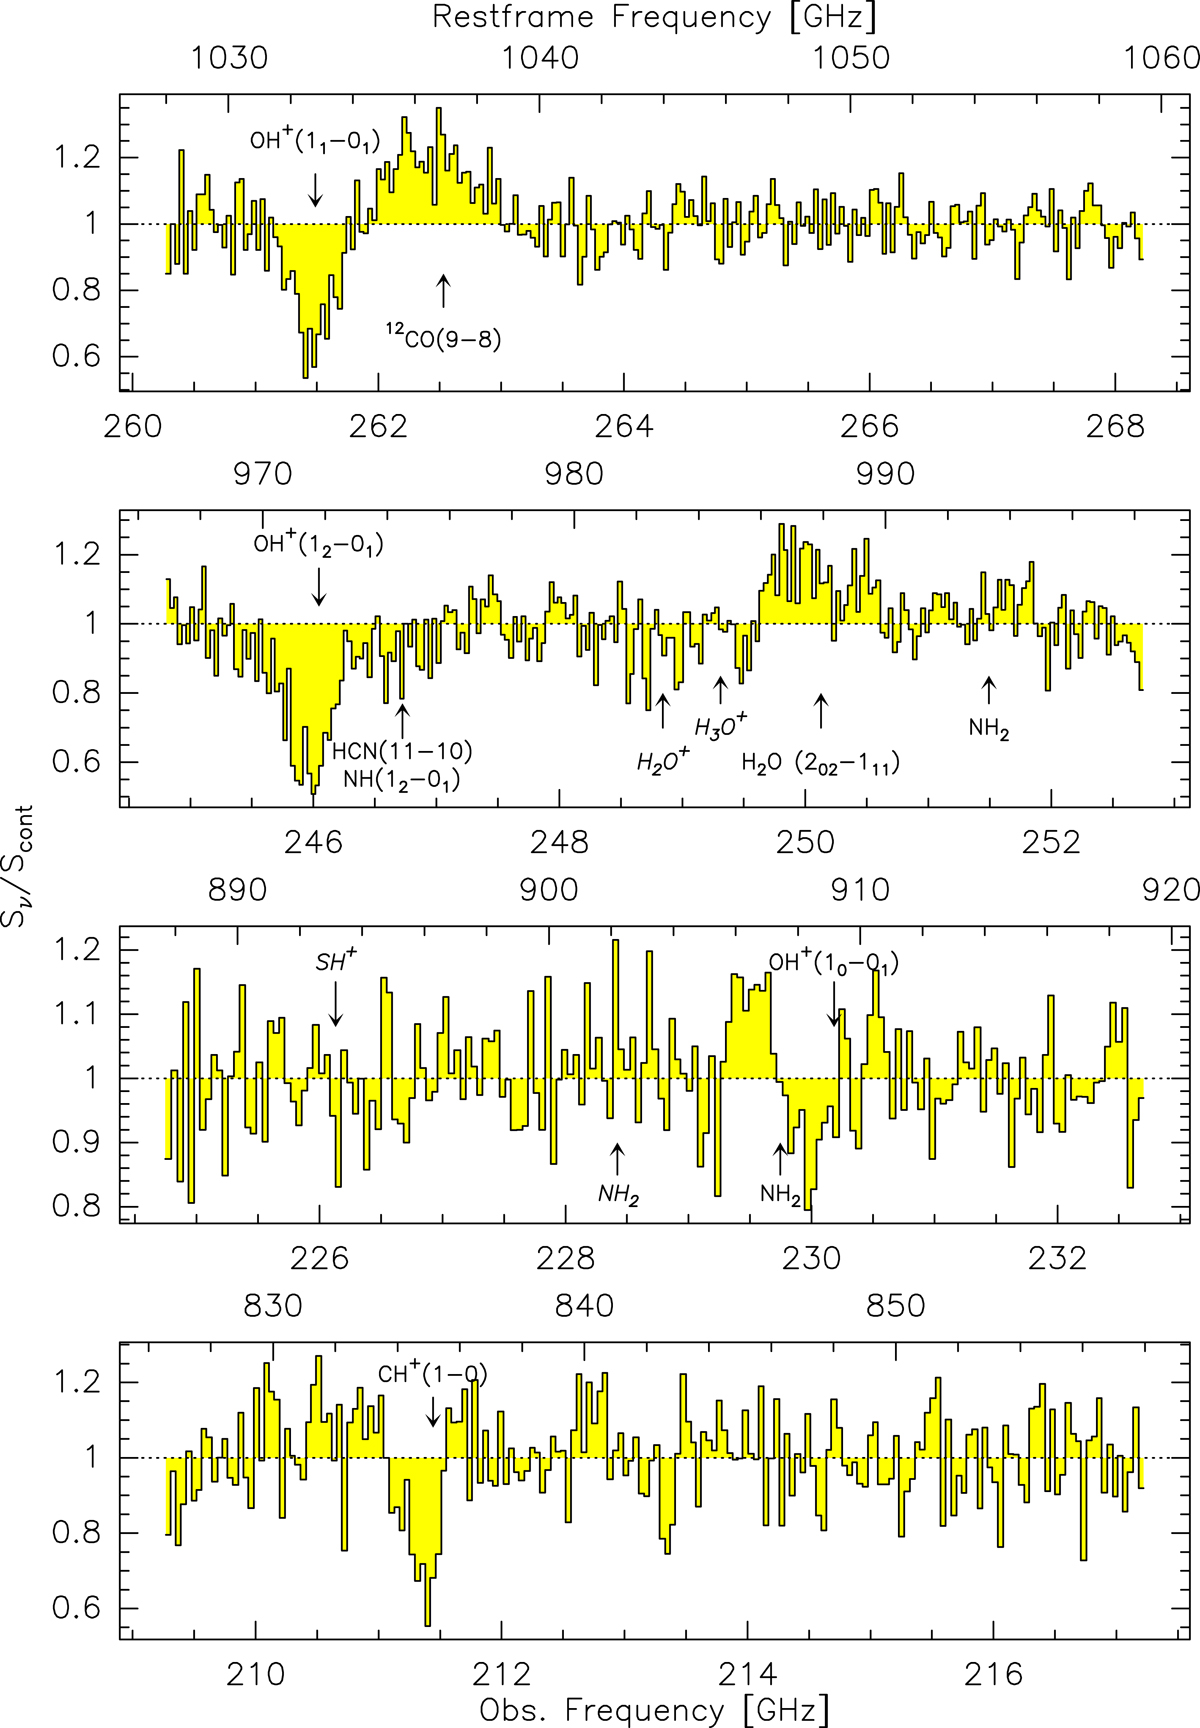
Spectra of HerBS-89a in the frequency ranges between 245 and 268 GHz and between 209 and 233 GHz. The spectra have been normalized by the continuum, which was modeled with a linear function (see text). The velocity channels were binned to 40 km s−1 for the 245−268 GHz data and 60 km s−1 for the 209−233 GHz data, reaching rms of 0.6 and 0.4 mJy per channel, respectively. The rest-frame and observed frequencies are given on the upper and lower horizontal axes, respectively. All the detected molecular emission and absorption lines are identified (with the arrows positioned at the line frequencies). In addition, the redshifted positions of molecular lines (at z = 2.9497) that fall within the observed frequency range, but were not detected, are indicated (in italics): ![]() , H2O+(312 − 303), SH+(2 − 1), and o − NH2(20, 2 − 11, 1)(3/2 − 1/2).
, H2O+(312 − 303), SH+(2 − 1), and o − NH2(20, 2 − 11, 1)(3/2 − 1/2).
Current usage metrics show cumulative count of Article Views (full-text article views including HTML views, PDF and ePub downloads, according to the available data) and Abstracts Views on Vision4Press platform.
Data correspond to usage on the plateform after 2015. The current usage metrics is available 48-96 hours after online publication and is updated daily on week days.
Initial download of the metrics may take a while.