Fig. A.3.
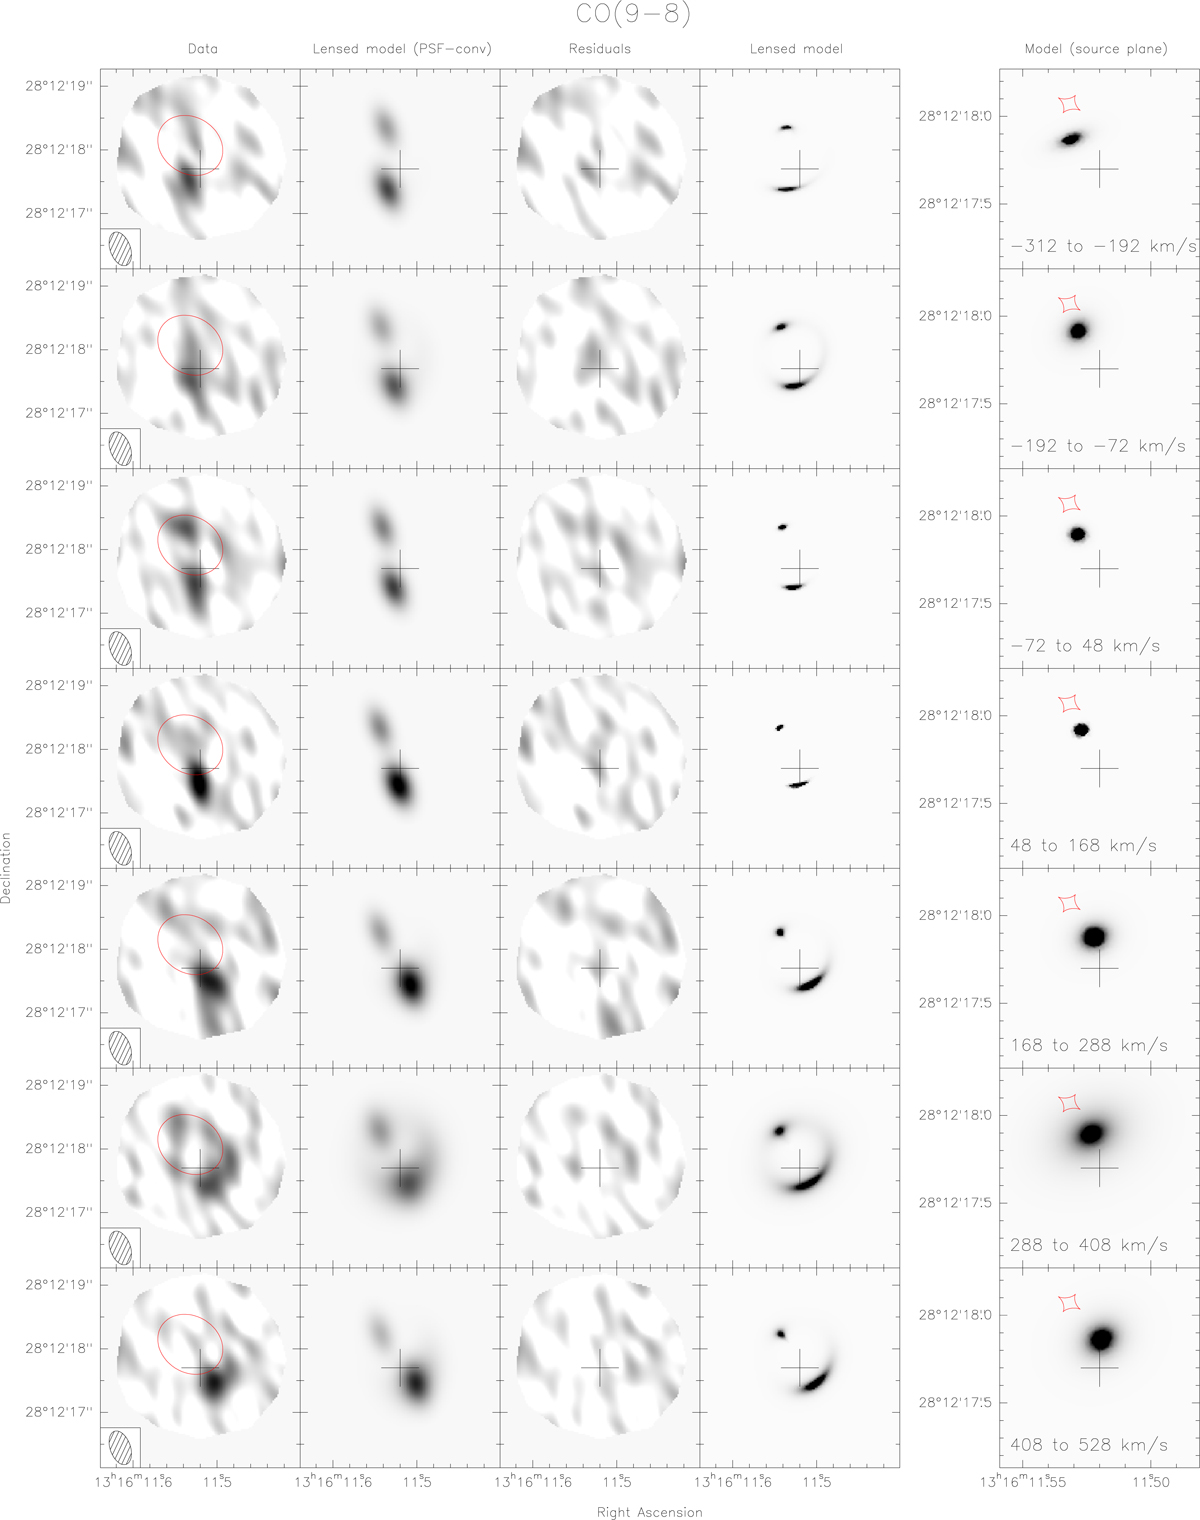
Lens modeling of the 12CO(9 − 8) spectral channels. The velocity ranges covered by each channel are marked in the right-hand panels. From left to right: observed image (with the synthesized beam shown in the lower left corner) and critical curve (red line); reconstructed model image convolved with the PSF; residuals, reconstructed model image at full angular resolution; and, separated and with a different angular scale, reconstructed source-plane images and caustic curve. The cross shows the central coordinate RA 13:16:11.52 and Dec +28:12:17.7 (J2000).
Current usage metrics show cumulative count of Article Views (full-text article views including HTML views, PDF and ePub downloads, according to the available data) and Abstracts Views on Vision4Press platform.
Data correspond to usage on the plateform after 2015. The current usage metrics is available 48-96 hours after online publication and is updated daily on week days.
Initial download of the metrics may take a while.