Fig. 18.
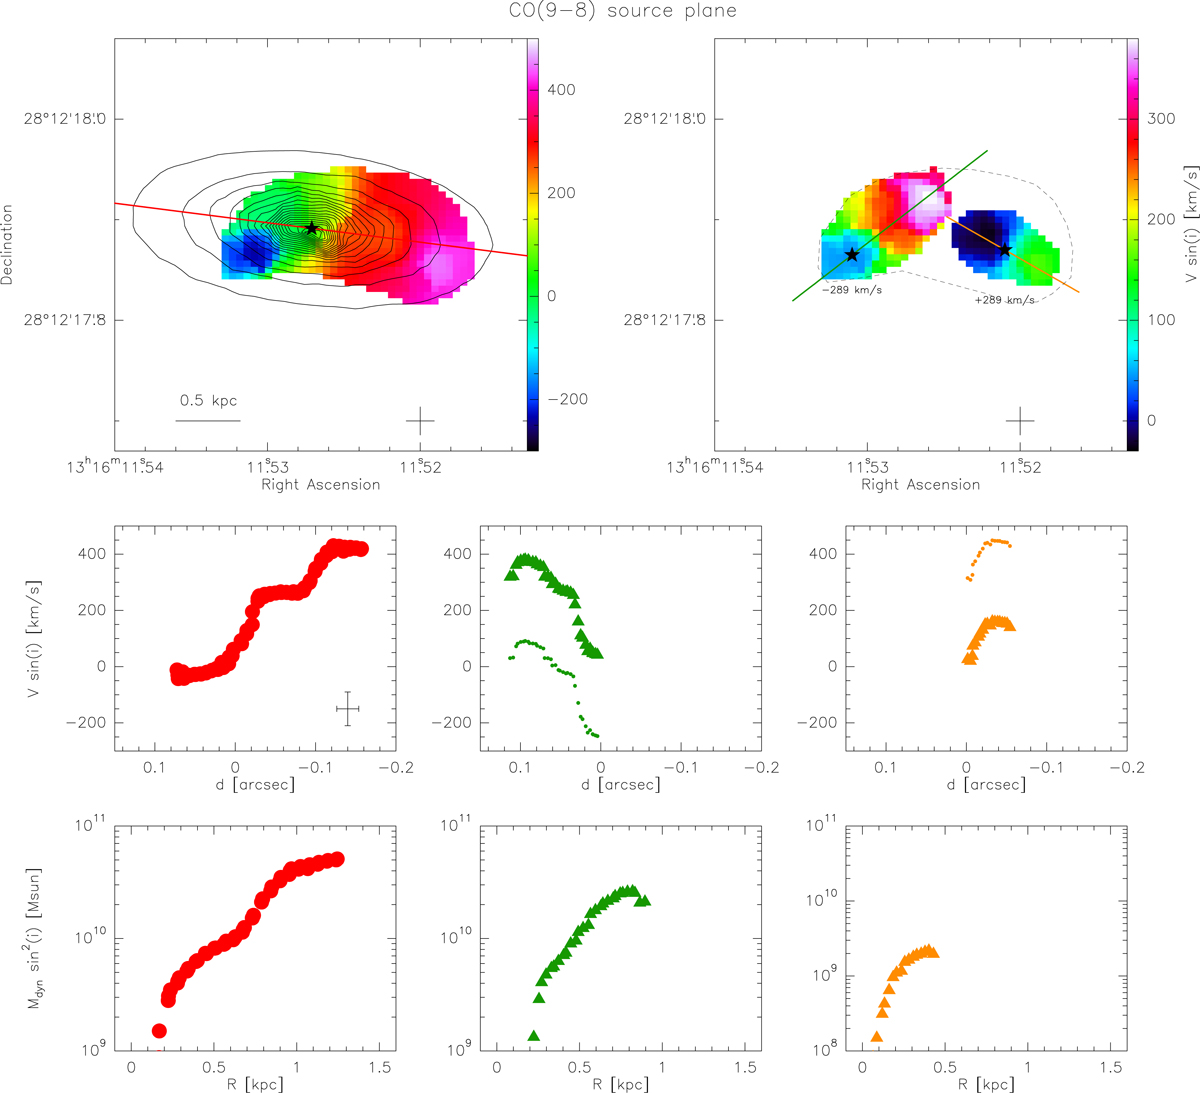
Kinematic and dynamical analysis of the 12CO(9 − 8) emission line in the source plane of HerBS-89a. Top panels: left: first moment map, compared to the Sérsic profile of the dust continuum emission. The contours start from 1/20 of the peak intensity with steps of 1/20th. The red line marks the continuum major axis. The reference position is defined where the rest-velocity (V = 0 km s−1) and is denoted with a star. From this position we calculate the radial distance. The cross at the lower right corner marks the phase center of the NOEMA observations. Right: based on Figs. A.3 and 17, two possible components are identified; the first moment maps of the two components are here shown, after shifting the velocity scale by ±289 km s−1 for clarity. The axes of the two components are shown as green and orange lines. The dashed line marks the contour of the velocity field shown in the top-left panel. Middle panels: velocity curves extracted along the axes marked in the top panels. Colors match those of the respective axes, with magenta points extracted from the top left moment map and the green and orange points extracted from the top right moment map. In the two right-most panels, the data are shown both before (small symbols) and after (large symbols) shifting by ±289 km s−1. The amplitude of the error bars is shown in the left-most panel. Bottom panels: dynamical mass profile as a function of radius, as derived from the velocity curves.
Current usage metrics show cumulative count of Article Views (full-text article views including HTML views, PDF and ePub downloads, according to the available data) and Abstracts Views on Vision4Press platform.
Data correspond to usage on the plateform after 2015. The current usage metrics is available 48-96 hours after online publication and is updated daily on week days.
Initial download of the metrics may take a while.