Fig. 17.
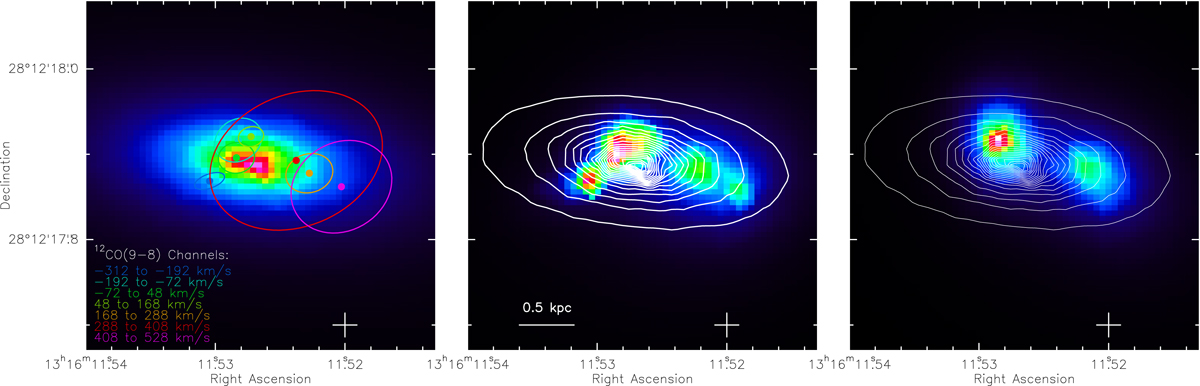
Source plane reconstruction split by spectral channels. Left panel: positions (colored thick dots) and shapes (ellipses) of the reconstructed profiles of the individual 12CO(9 − 8) channels, over-plotted on the map of the dust continuum emission in the source plane. The ellipses are plotted at 1/20th of the peak flux of each reconstructed channel map. Central panel: zeroth moment map of the 12CO(9 − 8) emission line derived from the reconstruction of the seven individual channels shown in the left panel. The contours show the dust continuum emission, starting at 1/20 of the peak flux in steps of 1/20th (see also Fig. A.3). Right panel: zeroth moment map obtained splitting the 12CO(9 − 8) in two halves, corresponding to the velocity ranges from −312 to 168 km s−1 and from 168 to 528 km s−1, and reconstructing them separately. In all panels, the cross at the lower right corner marks the phase center of the NOEMA observations.
Current usage metrics show cumulative count of Article Views (full-text article views including HTML views, PDF and ePub downloads, according to the available data) and Abstracts Views on Vision4Press platform.
Data correspond to usage on the plateform after 2015. The current usage metrics is available 48-96 hours after online publication and is updated daily on week days.
Initial download of the metrics may take a while.