Fig. 13.
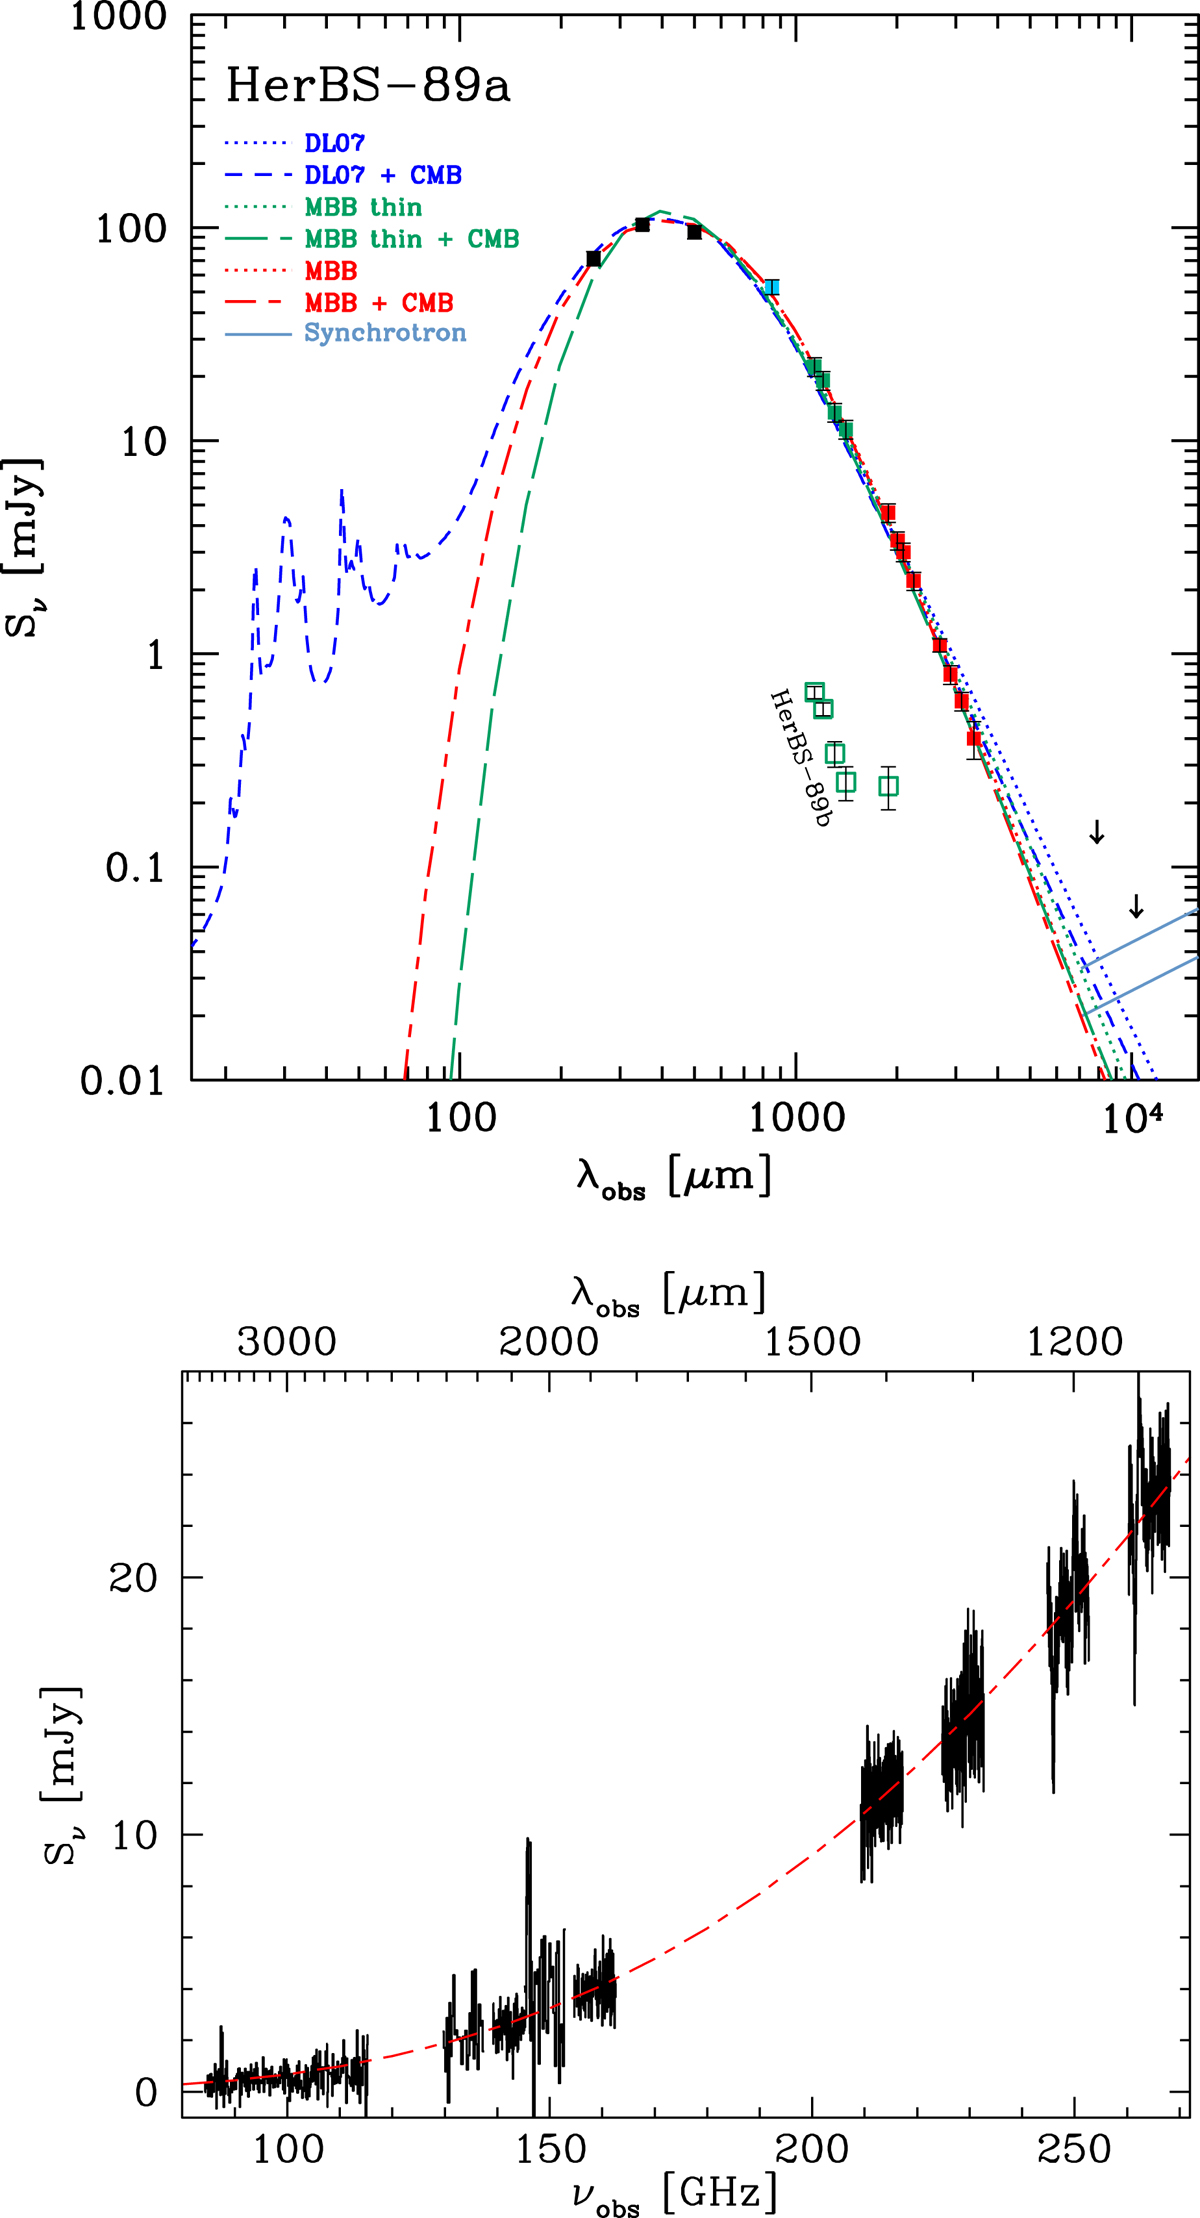
Spectral energy distribution. Top panel: observed SED of HerBS-89a (filled symbols) and 89b (open symbols). The HerBS-89a data are fit with three different dust models: DL07 (blue lines), optically-thin MBB (green lines); MBB in general form (red lines). The dotted lines represent the models as they are, and the dashed lines include the correction for the effects of CMB (see text for details). The light-blue continuous lines represent the synchrotron emission with a spectral index α = −0.8, normalized on the basis of the radio-FIR correlation subject to the redshift evolution found by Magnelli et al. (2015, upper line) and Delhaize et al. (2017, lower line). The data include SPIRE flux densities (black dots; from Bakx et al. 2018); SCUBA-2 photometry (blue dot; from Bakx et al. 2020); the NOEMA derived continuum flux densities at 1 mm continuum (green dots) from this work and 2 and 3 mm (red dots) from Neri et al. (2020); and 3σ upper limits at 29 and 38 GHz (10 and 7.8 mm, respectively) are derived from the VLA data (arrows). The data for HerBS-89b are taken from this paper for 1 mm and Neri et al. (2020) for 2 mm flux densities. Bottom panel: HerBS-89a NOEMA spectra (Neri et al. 2020, and this work) compared to the general form MBB model with CMB correction.
Current usage metrics show cumulative count of Article Views (full-text article views including HTML views, PDF and ePub downloads, according to the available data) and Abstracts Views on Vision4Press platform.
Data correspond to usage on the plateform after 2015. The current usage metrics is available 48-96 hours after online publication and is updated daily on week days.
Initial download of the metrics may take a while.