Fig. 12.
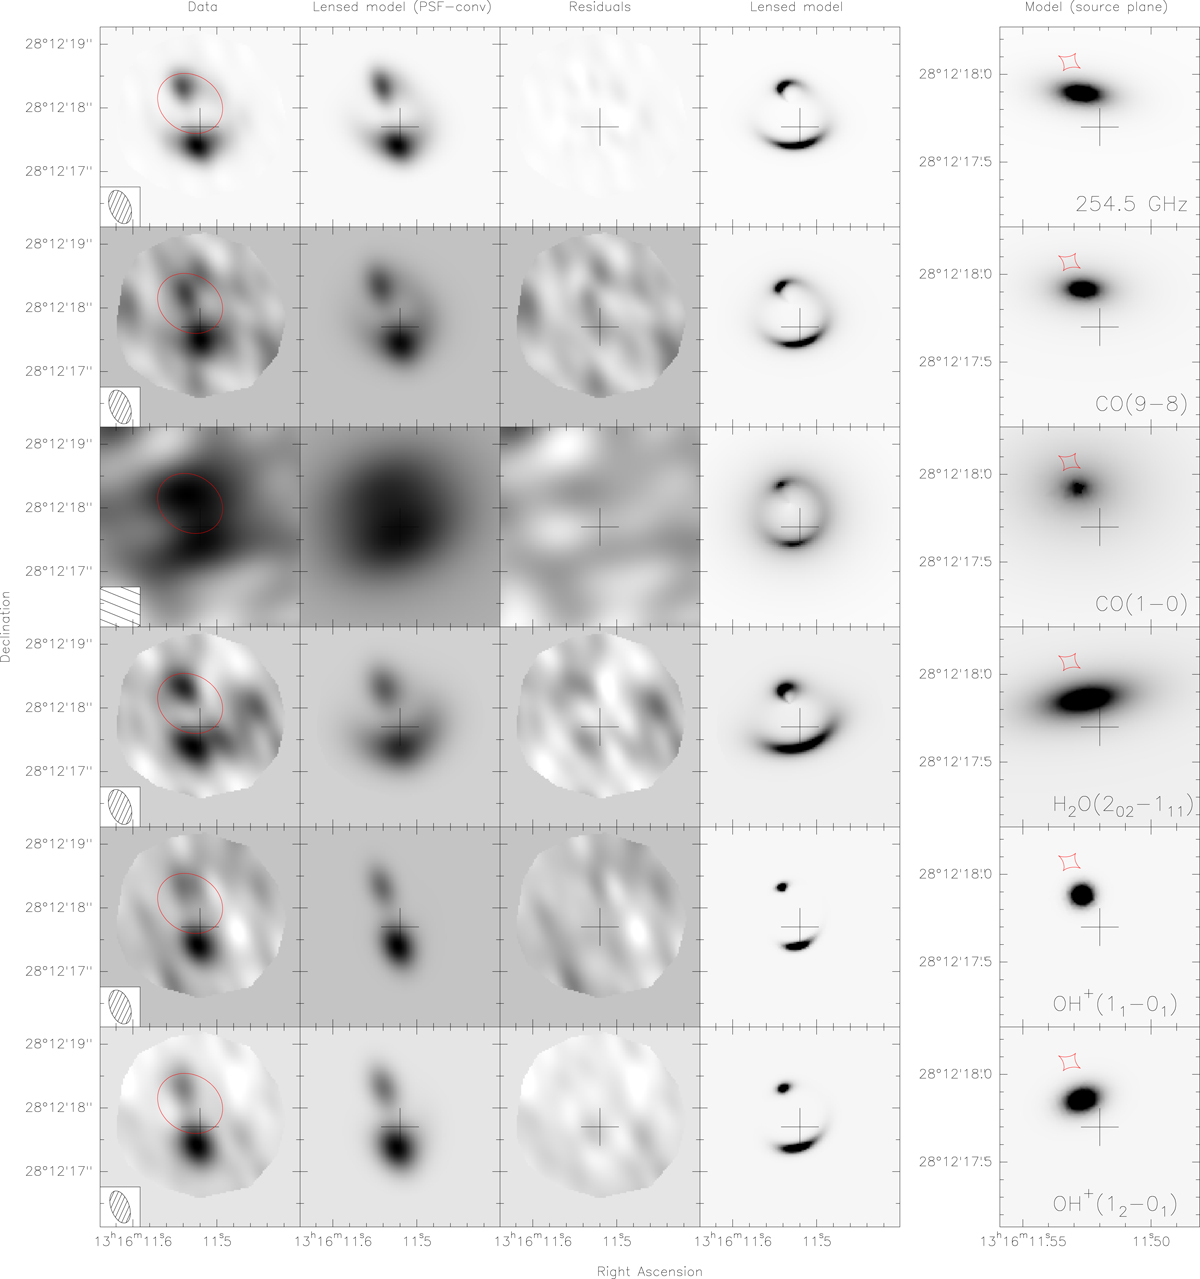
Lens modeling results for the 1.2 mm dust continuum emission and spectral lines in HerBS-89a (identified in the right most panels). In each row, from left to right: observed image (with the synthesized beam shown in the lower left corner) and critical curve (red line); reconstructed model image convolved with the PSF; residuals; reconstructed model image at full angular resolution; and (separated and with a different angular scale) reconstructed source-plane image and caustic. The residuals are within ±2.5σ, showing that the model agrees well with the data. The cross shows the coordinates of the phase center of NOEMA observations (RA 13:16:11.52 and Dec +28:12:17.7 in J2000). The OH+ absorption lines have been inverted to allow for a positive normalization of the Sérsic profile reconstruction.
Current usage metrics show cumulative count of Article Views (full-text article views including HTML views, PDF and ePub downloads, according to the available data) and Abstracts Views on Vision4Press platform.
Data correspond to usage on the plateform after 2015. The current usage metrics is available 48-96 hours after online publication and is updated daily on week days.
Initial download of the metrics may take a while.