Fig. 10.
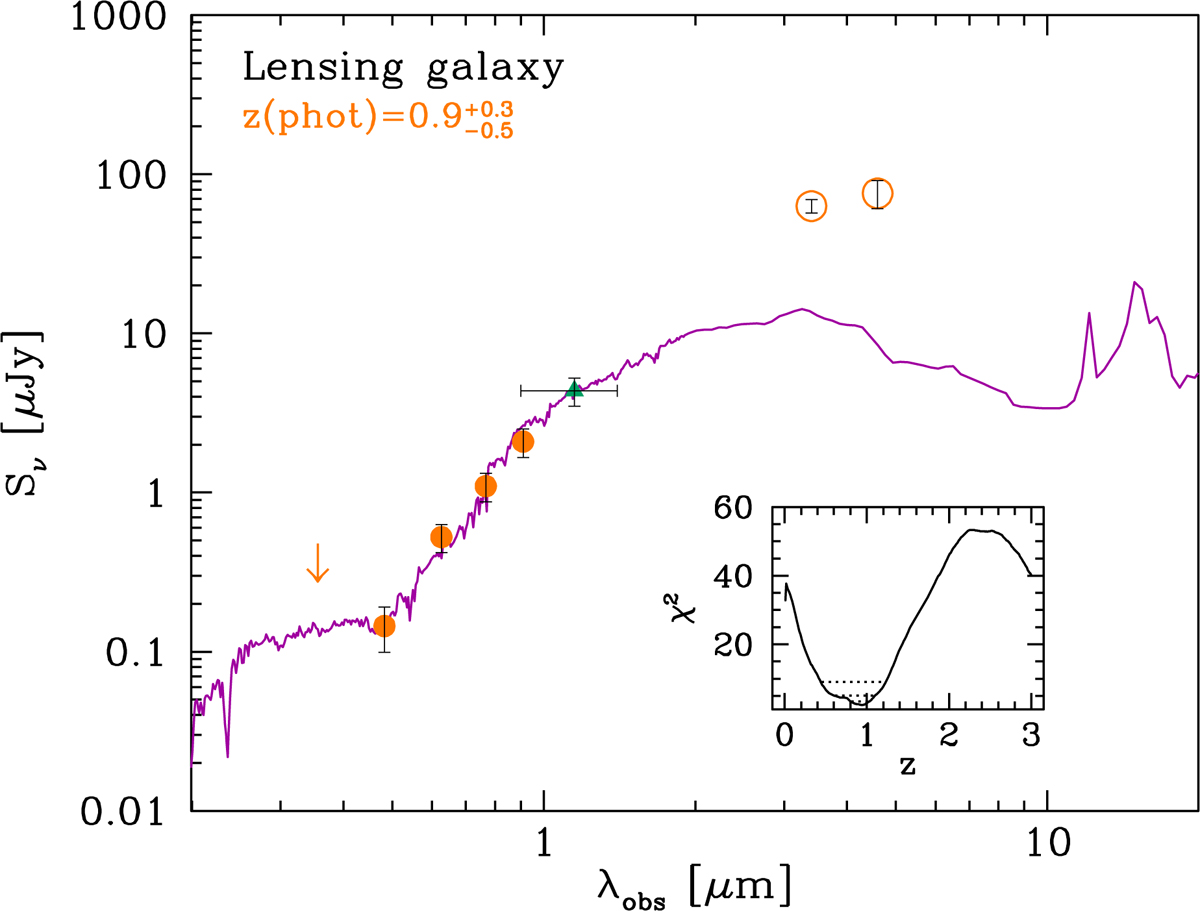
Best derivation of the photometric redshift of the foreground lensing galaxy, using the Le PHARE code (Ilbert et al. 2006; Arnouts et al. 1999). The filled triangle shows the HST F110W flux density and the filled circles represent the GTC measurements (see text). The WISE data (open circles) have not been included in the fit. The curve shows the best fit model, a Sb spiral template (Polletta et al. 2007; Ilbert et al. 2009). The inset displays the distribution of χ2 as a function of redshift; the dotted horizontal lines correspond to the 1, 2, 3σ levels, defined as ![]() . The best photometric redshift for the foreground galaxy is
. The best photometric redshift for the foreground galaxy is ![]() where the errors are 3σ.
where the errors are 3σ.
Current usage metrics show cumulative count of Article Views (full-text article views including HTML views, PDF and ePub downloads, according to the available data) and Abstracts Views on Vision4Press platform.
Data correspond to usage on the plateform after 2015. The current usage metrics is available 48-96 hours after online publication and is updated daily on week days.
Initial download of the metrics may take a while.