Fig. 1.
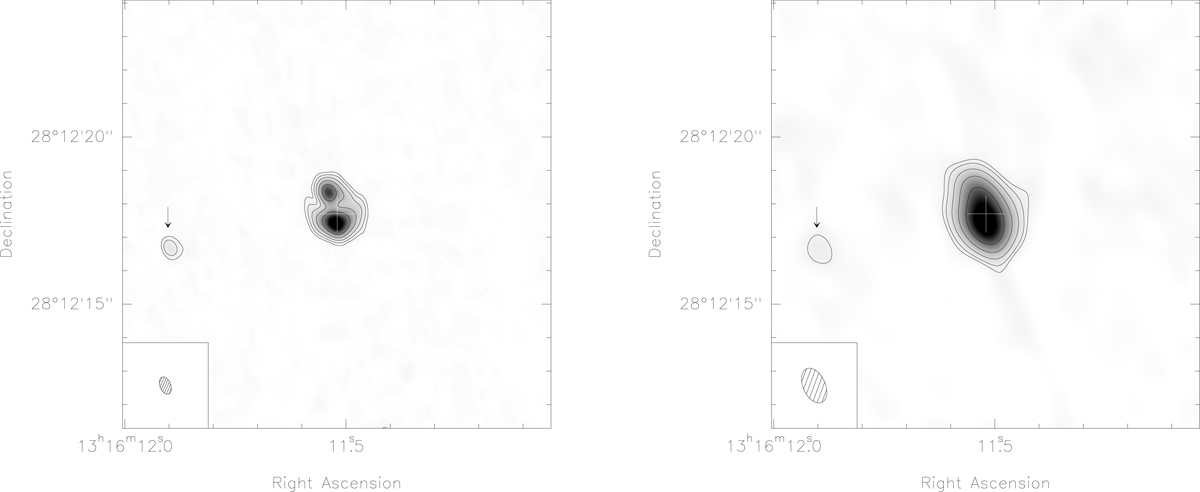
Continuum images of HerBS-89a at 1.2 mm, resulting from merging the lower and upper side bands of the two sets of NOEMA observations obtained with natural weighting of the visibilities (see Sect. 3.1.1 for further details). Contours are at 5, 10, 20, 40, 80σ levels. North is up, east is left. Left: high-angular resolution continuum image at 254.6 GHz with a beam size of ![]() . Right: lower-angular resolution image at 220.8 GHz with a beam size of
. Right: lower-angular resolution image at 220.8 GHz with a beam size of ![]() . The synthesized beam is shown in the lower left corner of each image, and the cross indicates the position of the phase center (RA 13:16:11.52, Dec +28:12:17.7). The weak source HerBS-89b, about
. The synthesized beam is shown in the lower left corner of each image, and the cross indicates the position of the phase center (RA 13:16:11.52, Dec +28:12:17.7). The weak source HerBS-89b, about ![]() to the east, is detected at both frequencies; the position of the source is indicated with an arrow and further details are provided in Sect. 3.1.1.
to the east, is detected at both frequencies; the position of the source is indicated with an arrow and further details are provided in Sect. 3.1.1.
Current usage metrics show cumulative count of Article Views (full-text article views including HTML views, PDF and ePub downloads, according to the available data) and Abstracts Views on Vision4Press platform.
Data correspond to usage on the plateform after 2015. The current usage metrics is available 48-96 hours after online publication and is updated daily on week days.
Initial download of the metrics may take a while.