Fig. 12.
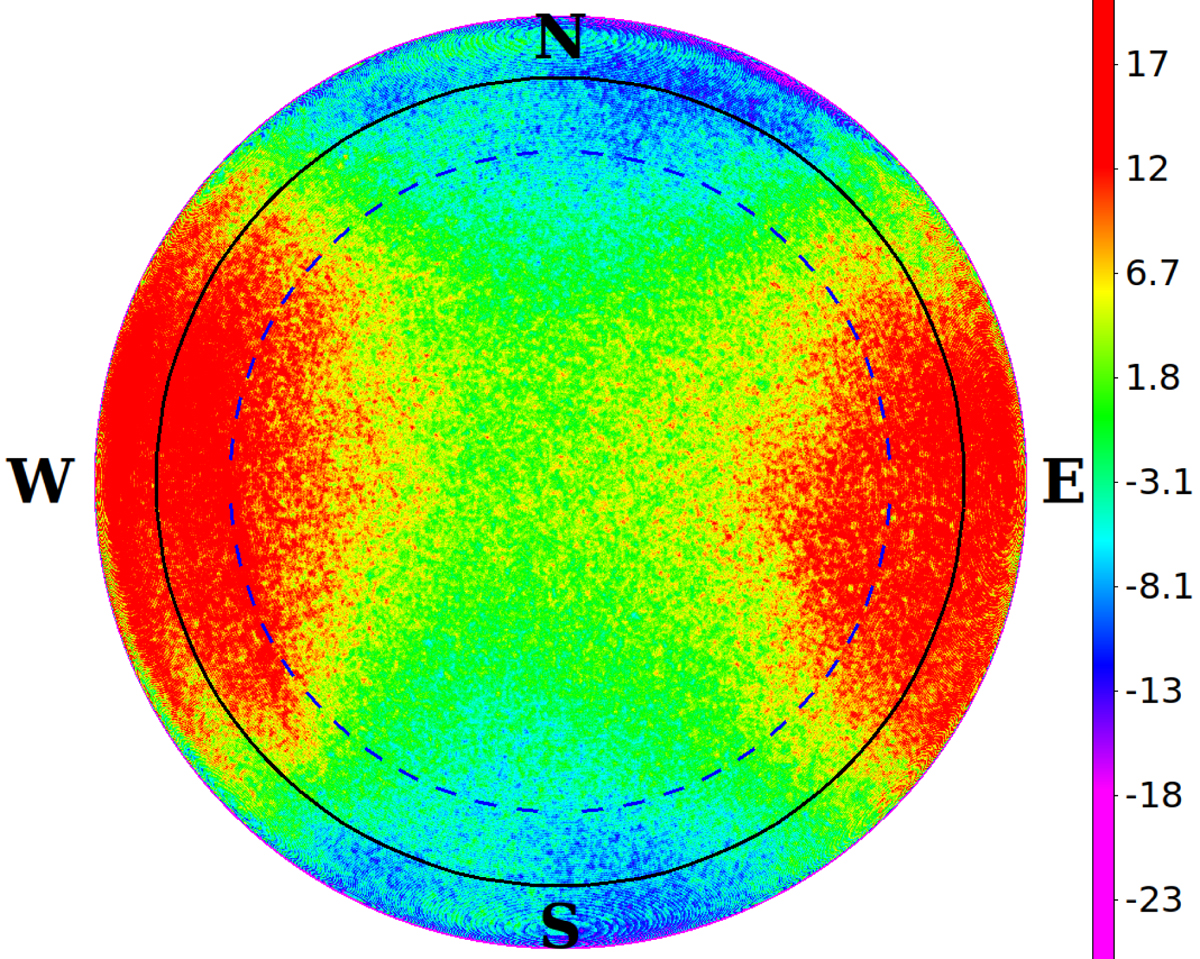
Relative difference between the data and simulations, ΔSEFD (in percent), calculated as ![]() . The agreement between the data and simulation at zenith is remarkable with measured sensitivity
. The agreement between the data and simulation at zenith is remarkable with measured sensitivity ![]() (ZA = 0°) = 463700 ± 200 Jy and simulated
(ZA = 0°) = 463700 ± 200 Jy and simulated ![]() (ZA = 0°) = 463250 ± 20 Jy (≈0.1% difference). Both values (
(ZA = 0°) = 463250 ± 20 Jy (≈0.1% difference). Both values (![]() and
and ![]() ) were calculated as the median and interquartile range based standard deviation in a 10-pixel radius around the centre. The black solid line is at ZA = 60 degrees, the blue dashed line is at ZA = 45 degrees, and the letters N, E, S, W show cardinal directions.
) were calculated as the median and interquartile range based standard deviation in a 10-pixel radius around the centre. The black solid line is at ZA = 60 degrees, the blue dashed line is at ZA = 45 degrees, and the letters N, E, S, W show cardinal directions.
Current usage metrics show cumulative count of Article Views (full-text article views including HTML views, PDF and ePub downloads, according to the available data) and Abstracts Views on Vision4Press platform.
Data correspond to usage on the plateform after 2015. The current usage metrics is available 48-96 hours after online publication and is updated daily on week days.
Initial download of the metrics may take a while.