Free Access
Fig. 7.
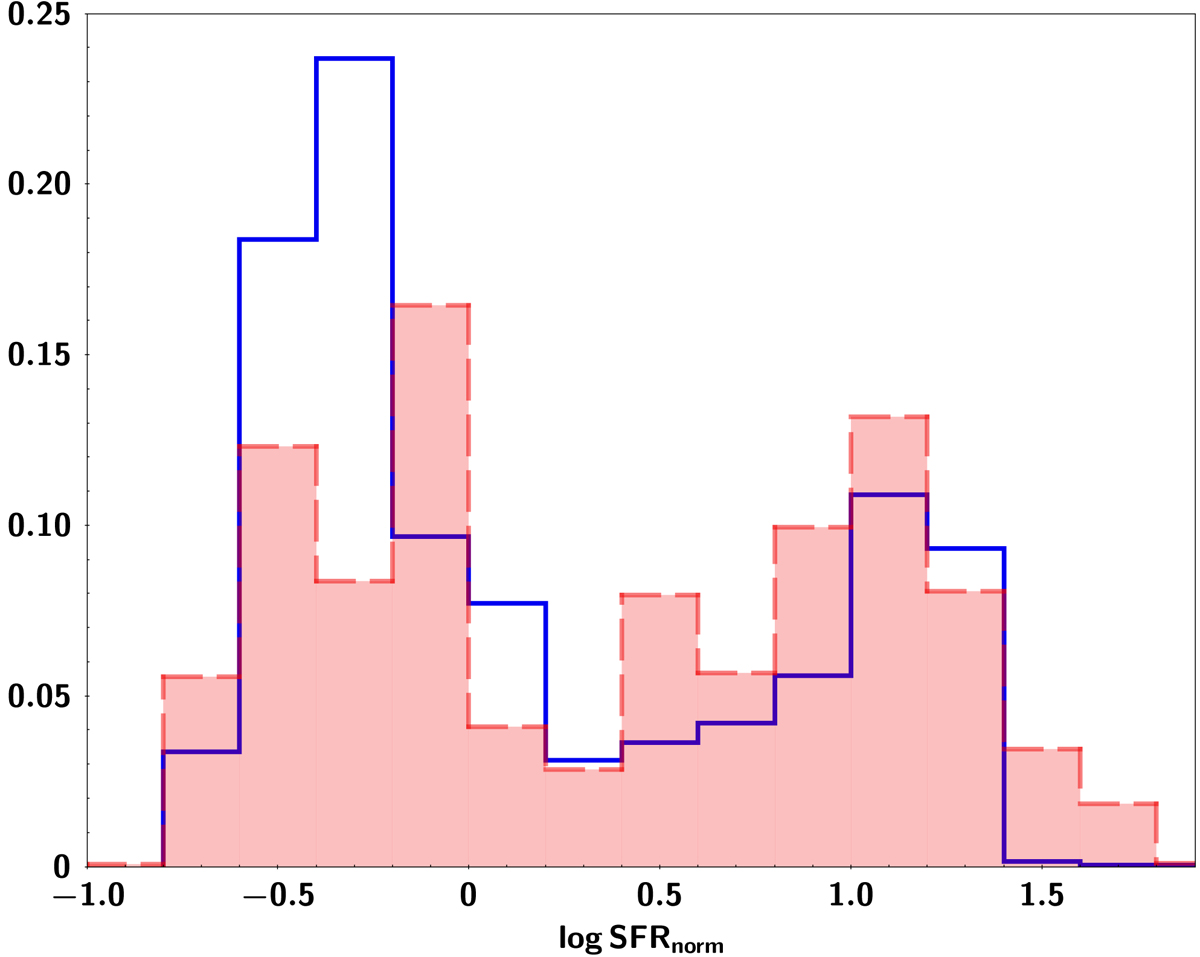
Normalised star formation rate distribution. The blue and red histograms refer to the unabsorbed and absorbed sources, respectively. The histogram has been normalised to the total number of sources. The two populations have similar normalised SFR distributions (p-value = 0.71). Both distributions are bimodal.
Current usage metrics show cumulative count of Article Views (full-text article views including HTML views, PDF and ePub downloads, according to the available data) and Abstracts Views on Vision4Press platform.
Data correspond to usage on the plateform after 2015. The current usage metrics is available 48-96 hours after online publication and is updated daily on week days.
Initial download of the metrics may take a while.