Free Access
Fig. 3.
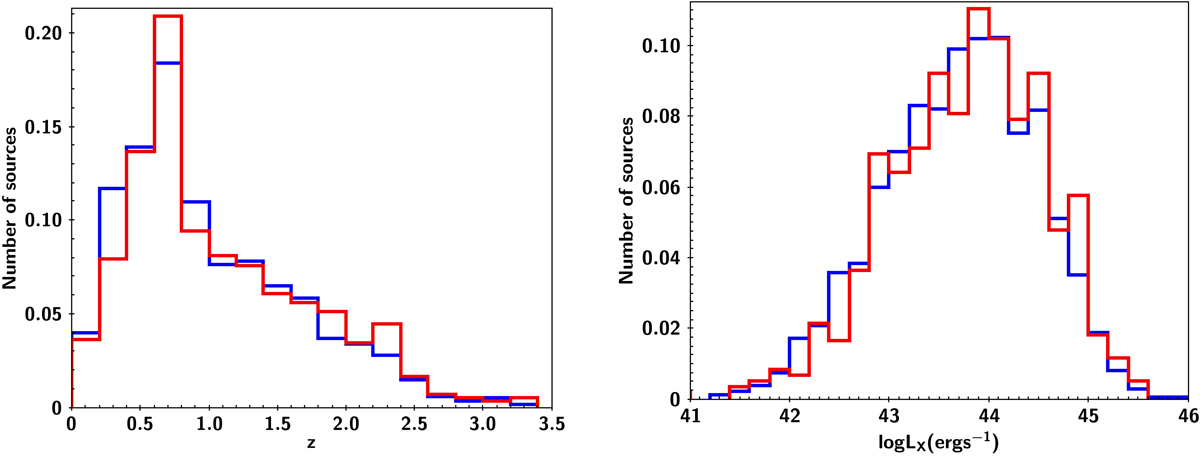
Left: redshift distribution of the examined sample. Right: intrinsic X-ray luminosity distribution of the examined sample. The blue and red histograms refer to the unabsorbed and absorbed sources, respectively. Both histograms have been normalised to the total number of sources.
Current usage metrics show cumulative count of Article Views (full-text article views including HTML views, PDF and ePub downloads, according to the available data) and Abstracts Views on Vision4Press platform.
Data correspond to usage on the plateform after 2015. The current usage metrics is available 48-96 hours after online publication and is updated daily on week days.
Initial download of the metrics may take a while.