Fig. 12.
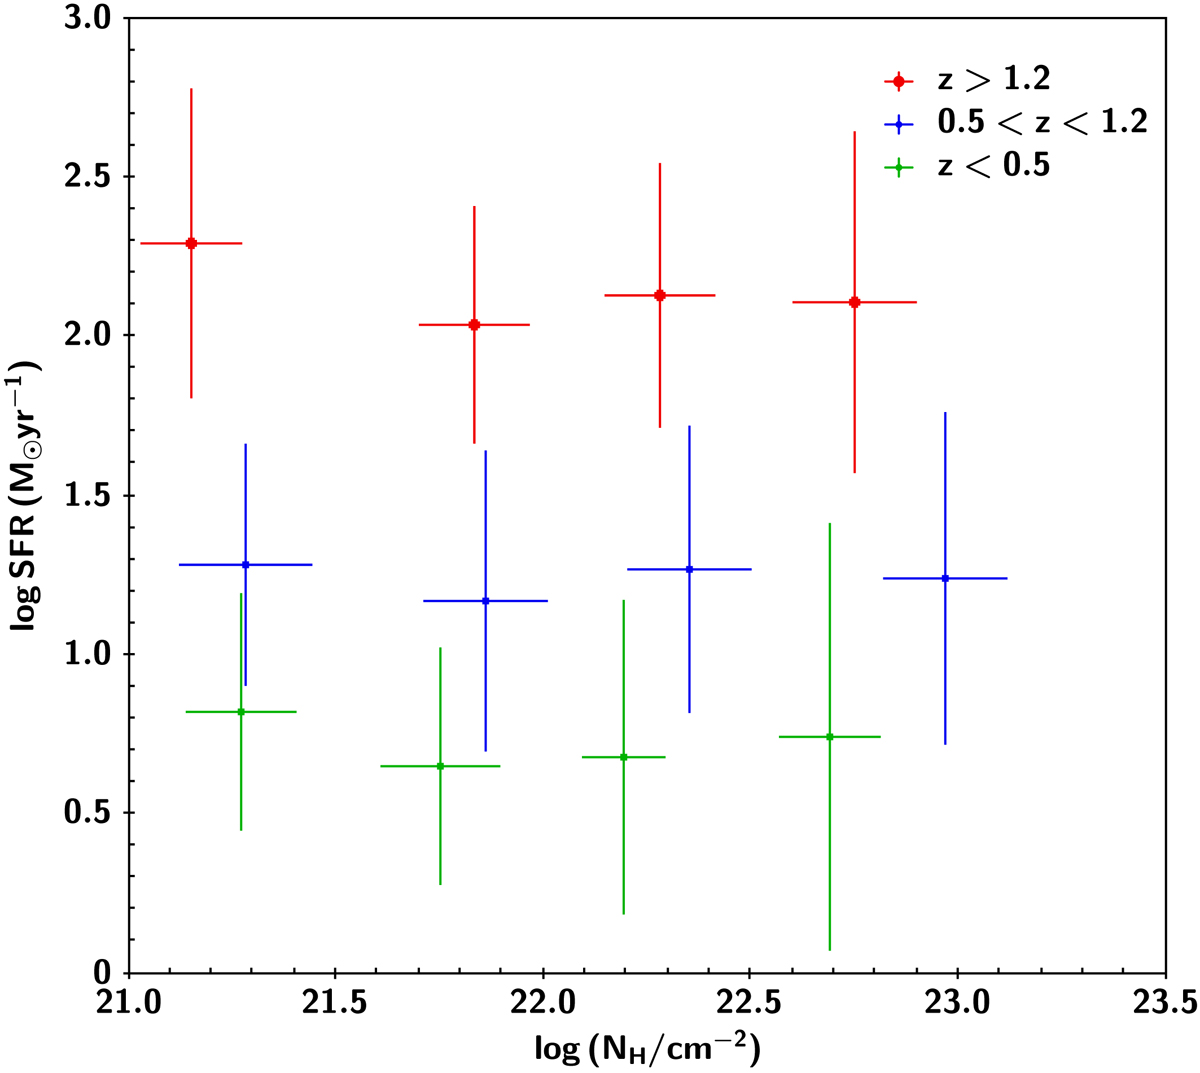
Star formation rate as a function of NH. The sample is split into redshift bins. The green, blue, and red symbols refer to z < 0.5, 0.5 < z < 1.2, and z > 1.2, respectively. Median SFRs and NH values are presented. The error bars represent the 1σ dispersion of each bin. Measurements reveal a flat relation between star formation and X-ray absorption at all redshift ranges.
Current usage metrics show cumulative count of Article Views (full-text article views including HTML views, PDF and ePub downloads, according to the available data) and Abstracts Views on Vision4Press platform.
Data correspond to usage on the plateform after 2015. The current usage metrics is available 48-96 hours after online publication and is updated daily on week days.
Initial download of the metrics may take a while.