| Issue |
A&A
Volume 646, February 2021
|
|
|---|---|---|
| Article Number | A114 | |
| Number of page(s) | 7 | |
| Section | Interstellar and circumstellar matter | |
| DOI | https://doi.org/10.1051/0004-6361/202039041 | |
| Published online | 19 February 2021 | |
HESS J1858+020: A GeV-TeV source possibly powered by cosmic rays from SNR G35.6-0.4
1
School of Physics and Astronomy, Sun Yat-Sen University,
Guangzhou
510275,
PR China
e-mail: This email address is being protected from spambots. You need JavaScript enabled to view it.
; This email address is being protected from spambots. You need JavaScript enabled to view it.
2
School of Physical Science and Technology, Southwest Jiaotong University,
Chengdu
610031,
PR China
e-mail: This email address is being protected from spambots. You need JavaScript enabled to view it.
3
Key Laboratory of Dark Matter and Space Astronomy, Purple Mountain Observatory, Chinese Academy of Sciences, Nanjing 210033, PR China
4
Institut für Astronomie und Astrophysik, Eberhard Karls Universität Tübingen,
Sand 1,
72076
Tübingen, Germany
5
Key Laboratory of Optical Astronomy, National Astronomical Observatories, Chinese Academy of Sciences,
Beijing
100101, PR China
Received:
27
July
2020
Accepted:
19
December
2020
Abstract
Context. The supernova remnant (SNR) G35.6−0.4 shows a non-thermal radio shell, however, no γ-ray or X-ray counterparts have been found for it thus far. One TeV source, HESS J1858+020, was found near the SNR and this source is spatially associated with some clouds at 3.6 kpc.
Aims. To attain a better understanding of the origin of HESS J1858+020, we further investigate the association between SNR cosmic rays (CRs) and the clouds through the Fermi-LAT analysis and hadronic modeling.
Methods. We performed the Fermi-LAT analysis to explore the GeV emission in and around the SNR. We explored the SNR physics with previously observed multi-wavelength data. We built a hadronic model using runaway CRs of the SNR to explain the GeV-TeV observation.
Results. We found a hard GeV source (SrcX2) that is spatially coincident with both HESS J1858+020 and a molecular cloud complex at 3.6 kpc. In addition, a soft GeV source (SrcX1) was found at the northern edge of the SNR. The GeV spectrum of SrcX2 connects well with the TeV spectrum of HESS J1858+020. The entire γ-ray spectrum ranges from several GeV up to tens of TeV and it follows a power-law with an index of ~2.15. We discuss several pieces of observational evidence to support the middle-aged SNR argument. Using runaway CRs from the SNR, our hadronic model explains the GeV-TeV emission at HESS J1858+020, with a diffusion coefficient that is much lower than the Galactic value.
Key words: ISM: supernova remnants / acceleration of particles / gamma rays: ISM / cosmic rays
© ESO 2021
1 Introduction
HESS J1858+020 is one of the first unidentified TeV source reported by Aharonian et al. (2008). In the H.E.S.S. Galactic plane survey (HGPS; H.E.S.S. Collaboration 2018), HESS J1858+020 is also considered as one of eleven HGPS sources that do not yet have any associations with known physical objects. In the context of the HAWC telescope (>100 GeV), which is mostly sensitive at ~10 TeV, there is no known 2HWC catalog source associated with HESS J1858+020 (Abeysekara et al. 2017).
The nearby radio source G35.6−0.4 located northwest of HESS J1858+020 was identified as a supernova remnant (SNR) by Green (2009). The radio boundary of this SNR is clearly shown in the 1.4 GHz image with VGPS (Stil et al. 2006; Zhu et al. 2013) and the 610 MHz image with GMRT (Paredes et al. 2014).
A molecular cloud (MC) complex composed of two clumps has been found to be spatially coincident with HESS J1858+020. Paron & Giacani (2010) argued that the TeV emission of HESS J1858+020 is likely due to the interaction between the SNR cosmic rays (CRs) and this MC complex. This argument is further corroborated in Paron et al. (2011) by excluding the possibility of a young stellar object as the power source. The velocity of this MC complex is ~55km s−1, corresponding to a near-side distance of ~3.4 kpc or a far-side distance of ~10.4 kpc. The H I study by Zhu et al. (2013) suggested a distance to this SNR-cloud system of 3.6 ± 0.4 kpc and this distance is also supported by the further H I study by Ranasinghe & Leahy (2018). It was suggested that two nearby pulsars – PSR J1857+0212 and PSR J1857+0210 could be be associated with the SNR (Phillips & Onello 1993; Morris et al. 2002). However, these pulsar associations were disfavored by this newly confirmed distance of 3.6 ± 0.4 kpc because the dispersion measure distances to PSR J1857+0212 and PSR J1857+0210 were estimated to be 7.98 kpc and 15.4 kpc, respectively (Han et al. 2006; Morris et al. 2002).
No diffuse X-ray emission has been found in or around SNR G35.6−0.4 with a 30 ks Chandra observation (Paredes et al. 2014). However, seven X-ray point sources without IR counterparts have, in fact, been detected. Four of these point sources lie inside the SNR and their spectral properties resemble those of embedded protostars (Paredes et al. 2014).
The previous Fermi-LAT study on SNR G35.6−0.4 by Torres et al. (2011) found no GeV detection. Hadronic models using the SNR as the power source were considered by Torres et al. (2011) and the authors suggested a low diffusion coefficient in order to explain the lack of GeV emission. In the 3FHL catalog, an extended source, 3FHL J1857.7+0246e, was shown to lie north of HESS J1858+020. However, the relation of 3FHL J1857.7+0246e, which is itself centered within the HESS J1857+026 region, with HESS J1858+020 is not straightforward. Recently, two point 4FGL sources at SNR G35.6−0.4 were added in the newest 4FGL catalog (Abdollahi et al. 2020). Therefore, we proceeded to perform our own Fermi analysis of the SNR.
In this work, we further explore the hadronic origin of the GeV-TeV emission at SNR G35.6−0.4. In Sect. 2, we reanalyse the Fermi-LAT data of SNR G35.6−0.4 with improved data and tools. We find a hard GeV component at HESS J1858+020, which has a smooth correlation with the H.E.S.S. data, and its entire γ-ray spectrum extends from several GeV up to tens of TeV. Assuming the GeV-TeV emission of HESS J1858+020 is powered by escaped CRs from SNR G35.6−0.4, then the scenario of a middle-aged SNR is favored because of its capacity to release low-energy CRs (≲100 GeV). In Sect. 3, we look for evidence of a middle-aged SNR from previous multi-wavelength observations. In Sect. 4, we build a hadronic model to explain the GeV-TeV spectrum of HESS J1858+020.
2 Fermi-LAT data analysis
2.1 Data preparation
In the following analysis, we selected the latest Fermi-LAT Pass 8 data with a “Source” event class (evclass = 128 & evtype = 3), taken in the period between August 4, 2008 (Mission Elapsed Time 239 557 418) and May 1, 2019 (Mission Elapsed Time 578 361 605). For the spectral analysis, the energy range adopted is 1–500 GeV, while the analysis of the morphology was carried out in the 5–500 GeV range in consideration of the improved LAT resolution at higher energies. The events with zenith angles greater than 90° are excluded to reduce the contamination from the Earth Limb. The region of interest (ROI) is a 14° × 14° square region centered at the position of HESS J1858+020 (Aharonian et al. 2008) and the standard LAT analysis software, FermiTools1, was adopted. The Galactic and isotropic diffuse background emissions are modeled according to gll_iem_v07.fits and iso_P8R3_SOURCE_V2_v1.txt2. All the sources listed in the 4FGL catalog (Abdollahi et al. 2020) within a radius of 20° from the ROI center, together with the two diffuse backgrounds, are included in the background model.
In the vicinity of HESS J1858+020, there are two 4FGL point sources called 4FGL J1858.3+0209 (RA = 284.58°, Dec = 2.15°) and 4FGL J1857.6+0212 (RA = 284.42°, Dec = 2.20°), and yet these two 4FGL sources have no associations. Further to the north, also there is an extended source known as 4FGL J1857.7+0246e (Abdollahi et al. 2020), which is associated with HESS J1857+026 (Aharonian et al. 2008). Recent MAGIC observations revealed that the >1 TeV emission at HESS J1857+026 can be spatially separated into two sources: MAGIC J1857.2+0263 and MAGIC J1857.6+0297 (MAGIC Collaboration 2014). The extension of 4FGL J1857.7+0246e is much larger than the TeV extension of HESS J1857+026 recorded by MAGIC Collaboration (2014).
Close to the SNR, we can find the TeV source HESS J1858+020. This nearly point-like source shows a slight extension of 5′ (Aharonian et al. 2008), which is shown as a white circle in Fig. 1. The observations with MAGIC (MAGIC Collaboration 2014) also show a point-like source at HESS J1858+020 (named as MAGIC-south). However, the TeV emission around the SNR is not investigated by the MAGIC Collaboration (2014) and no flux or spectral information of MAGIC-south is given due to its relatively low exposure at its angular distance from the MAGIC pointing positions. In our Fermi-LAT analysis below, we also performed an analysis with the HESS/MAGIC image of HESS J1858+020 as an extended template.
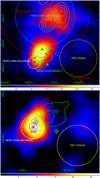 |
Fig. 1 TS maps for photons above 5 GeV(top) and 10 GeV(bottom) are shown. Both of the maps are smoothed with a σ = 0.03° Gaussian kernel. The PSF of a single 5 GeV/10 GeV photon is also shown in dashed yellow circles. The red cross and circle show a point source – 4FGL J1855.8+0150 and an extended source – 4FGL J1857.7+0246e, respectively. The two black crosses represent two point sources – 4FGL J1858.3+0209 and 4FGL J1857.6+0212. The diamonds represent “SrcX1” and “SrcX2”, which are the best fitted position of the two sources discovered in our analysis. Bottom panel: 1σ error radius of SrcX1 and SrcX2 are also shown in dashed circles. The cyan dashed circle in the top panel shows the TeV extension of HESS J1857+026, which is adopted to be one of the spatial templates. The cyan contours and white circle represent the MAGIC image and the H.E.S.S. image, respectively. The green contours show the VGPS data at 1.4 GHz with an arcminute resolution, and the magenta contours display the 13CO J = 1–0 emission for CloudX2. In both panels, the x-axis are the right ascension (RA), and the y-axis are the declination (Dec). |
Best-fit position, spectral parameters, and TS values of SrcX1/SrcX2 for different energy bands with point source assumptions.
2.2 Spatial analysis of the GeV sources
For the purposes of carrying out a more detailed study of the emission around SNR G35.6-0.4/HESS J1858+020, we firstly derive test-statistic(TS) maps by excluding 4FGL J1858.3+0209, 4FGLJ1857.6+0212, and 4FGL J1857.7+0246e from the background model. Both the >5 GeV and >10 GeV TS maps are shown in Fig. 1. As clearly seen in the SNR region, the 5 GeV photons are mostly concentrated at the northeastern edge of the SNR, while the 10 GeV photons are mostly around HESS J1858+020. This spatial difference between 5 GeV and 10 GeV TS maps seems to indicate a two source scenario. Assuming these two sources are point sources, we hereafter fit the coordinates of the two sources with the command gtfindsrc and rename them as SrcX1 and SrcX2.
In the course of the following analysis, which focus on finding the spatial and spectra information of SrcX1 and SrcX2, the extended source 4FGL J1857.7+0246e was treated as a background source. Both a uniform disk (the TeV extension of HESS J1857+026, the cyan circle in Fig. 1) and the MAGIC image of HESS J1857+026 (the cyan contours north of the SNR in Fig. 1) were used as the spatial template of 4FGL J1857.7+0246e and their analysis results in the scope of the SNR region essentially remain the same.
Using only the >5 GeV data, the best-fit position of SrcX1 was found to be RA = 284.476°, Dec = 2.265°, with 1σ error radius of 0.040°. And for SrcX2, the best-fit position and its 1σ error radius are RA = 284.578°, Dec = 2.095° and 0.029°, respectively. The TS (Mattox et al. 1996) values of SrcX1 and SrcX2 were fitted to be 49.1 and 39.3, corresponding to the significant level of 6.2σ and 5.4σ, respectively. More comparisons between SrcX1 and SrcX2 in different energy bands are list in Table 1.
Additionaly, extended spatial templates of SrcX1 & SrcX2 were also explored to test their spatial extensions. These templates include uniform disks with a different radius, the MAGIC-south image of HESS J1858+020 and the HESS image of HESS J1858+020. Ultimately, these extended spatial templates basically show no improvement in the significance of SrcX1/SrcX2 and point sources are enough to describe their γ-ray emissions.
In Fig. 1, the radio contours of SNR G35.6−0.4 at 1.4GHz with VGPS (Stil et al. 2006; Zhu et al. 2013) and the contours of nearby TeV sources (Aharonian et al. 2008; MAGIC Collaboration 2014) are plotted. The eastern cloud traced by the 13CO J = 1–0 emission with a velocity range between 51 and 59 km s−1 (Paron & Giacani 2010) is shown in purple contours and named “CloudX2” for the purposes of this work. As can be seen, the position of SrcX2 is in good correspondence with the TeV image of HESS J1858+020 and CloudX2, while SrcX1 appears to be corresponding to the radio shell of SNR G35.6−0.4.
2.3 Spectral analysis of the GeV sources
With the best positions of SrcX1 and SrcX2 obtained from the 5–500 GeV data (see Table 1), we used gtlike to fit the power-law spectra of them in theenergy range of 1–500 GeV. The spectral index and total photon flux of SrcX1 are 3.09 ± 0.09 and (6.55 ± 0.52) × 10−9 photon cm−2 s−1. While the spectral index and total photon flux of SrcX2 are fitted as 2.27 ± 0.14 and (1.59 ± 0.40) × 10−9 photon cm−2 s−1.
To derive the spectral energy distribution (SED) of SrcX2 at different energies, we binned the data with six logarithmically even energy bins between 1 GeV and 500 GeV and we performed the same likelihood fitting analysis to the data. Considering the much softer spectrum of SrcX1, we derived the energy band of 1–50 GeV into eight bins to obtain its SED. For the energy bin with the TS value of SrcX1/SrcX2 smaller than 5.0, an upper limit with 95% confidence level was calculated. The results of the spectral analysis are shown in Fig. 2.
In summary, we performed the Fermi-LAT analysis around SNR G35.6−0.4 and found two distinct GeV sources: one displaying a hard GeV spectrum (SrcX2) is in spatial coincidence with HESS J1858+020 and CloudX2; the other one displaying a soft GeV spectrum (SrcX1) is located at the northern edge of the SNR. The GeV spectrum of SrcX2 connects well with the TeV spectrum of HESS J1858+020 and together, they show a hard GeV-TeV spectrum with a power-law index of ~2.15.
3 Multi-wavelength observations around SNR G35.6−0.4
3.1 SNR size and distance
In adopting the 1.4GHz image with VGPS (see Fig. 3), we obtained a close-up of the complex with an angular size of ~ 13′ −17′ and a center at RA = 284.457°, Dec = 2.176° (Zhu et al. 2013).
The most up-to-date H I & CO studies by Zhu et al. (2013) and Ranasinghe & Leahy (2018) suggest that the distance to the SNR-cloud system (SNR G35.6−0.4 & Eastern cloud) is 3.6 ± 0.4 kpc, and 3.8 ± 0.3 kpc, respectively.We adopted a distance of 3.6 kpc in our model and this value leads to an averaged SNR radius of ~ 8 pc.
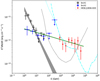 |
Fig. 2 Fermi-LAT SED of SrcX1 (black dots) and SrcX2 (blue dots), with arrows indicating the 95% upper limits. Red dots represent the HESS observation of HESS J1858+020 (Aharonian et al. 2008). Gray butterfly indicates the best-fit power-law of SrcX1 in the energy range of 1–500 GeV. Solid green line is the joint fit for the Fermi-LAT data of SrcX2 and HESS data of HESS J1858+020. The cyan dotted and dot-dashed lines show the differential sensitivities of LHAASO (1 yr) with different sizes of photomultiplier tube (PMT; Bai et al. 2019). Black dotted line represents the differential sensitivity of CTA-North (50 h; CTA Consortium 2019). |
3.2 Considering a possible middle-aged SNR
As described in Sect. 2.3, the γ-ray spectrum at CloudX2 extending down to several GeV seems to indicate that this is the case of a middle-aged SNR. So far, there is no direct observational evidence for the shock velocity. In following: we discuss the evidence based on multi-wavelength studies in favor of a middle-aged SNR.
γ-ray emission extending down to several GeV
The flat γ-ray spectrum at CloudX2 ranges from several GeV to tens of TeV, which is similar to those of the middle-aged SNRs associated with MCs, such as SNR W28, W44, and IC 443. Its flat spectral shape, in particular, resembles those of the clouds (240A,B,C) next to but not in direct proximity to SNR W28 (Abdo et al. 2010; Hanabata et al. 2014; Cui et al. 2018). If a hadronic origin is assumed, then the SNR has already released CRs with energies down to tens of GeV into CloudX2. A slow shock (vSNR ≪ 1000 km s−1) at present can achieve an escape energy of ~10 GeV with the help of the damping of magnetic waves by neutrals (O’C Drury et al. 1996). It could be argued that a young SNR can also release the GeV CRs to MCs through a shock-cloud collision scenario (Cui et al. 2019; Tang et al. 2015). Nonetheless, there is no evidence from the linewidth of the molecular clouds that are interacting with the SNR; for example, no line asymmetry was found at CloudX2 (Paron et al. 2011).
An intrinsic weak X-ray emission
The non-detection of diffuse X-ray emission (Paredes et al. 2014) can be either due to the intrinsic nature of the SNR or the heavy absorption. The total H column density along the line of sight (LOS) of G35.6−0.4 is NH,total ≈ 1.44 × 10²² H cm−2 (Willingale et al. 2013). The extinction curve along the LOS of the SNR becomes flat behind ~ 3.4 kpc (Green et al. 2019). This indicates that most of the observed gas lies in front of the SNR (3.6 kpc) and the column density up to 3.6 kpc is about 96% NH,total. Obviously, this 1.44 × 10²² H cm−2 is not thick enough to absorb most keV photons; see, for example, the SNRs with higher NH displaying X-ray emissions (Zhu et al. 2017). Hence, the non-detection of diffuse X-ray emission is likely due to an intrinsic weak source.
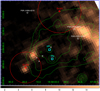 |
Fig. 3 13 CO map around SNR G35.6−0.4 is shown, where the CO data is obtained from GRS. The x-axis and y-axis represent the RA and Dec, respectively. Noticeably, only the contours of CloudX2 is shown in Fig. 1, meanwhile the western clouds that lack γ-ray counterparts are neglected in this work. The 1.4 GHz image from VGPS is marked in green contours. The best fitted position of SrcX1 and SrcX2 are marked in red diamonds, red circles represent their position uncertainties (2σ). The X-ray point sources and the nearby pulsars are marked in white crosses and circles, respectively. The H II region G35.6−0.5 and the planetary nebulae PN G35.5−0.4 are marked in cyan boxes. |
A hard radio index
The non-thermal radio spectrum of SNR G35.6−0.4 displays an index of α = 0.47 ± 0.07 (Green 2009). This value is much harderthan the ones (α ≈ 0.6 − 0.8) measured inyoung SNRs (Dubner & Giacani 2015).
Ultimately, we find that SNR G35.6−0.4 is likely to prove a middle-aged SNR but none of this evidence is conclusive at present. Noticeably, with an ambient density of 1 H cm−3, a SNR distance of 3.6 kpc will lead to a SNR age of merely 2 kyr. In the modeling section below, we adopt this middle-aged SNR scenario in order to improve the release of <100 GeV CRs – hence, a relatively higher ambient density is required.
3.3 The circumstellar medium and other observations
Following the 13CO study by Paron & Giacani (2010) and the distance study by Zhu et al. (2013), CloudX2 is shown to have a mass of ~ 5.0 × 10³M⊙; see also Fig. 3. The projected distance between CloudX2 and the SNR center is ~ 8 pc. The even larger clouds located at the western side of the SNR lack GeV-TeV counterpart, hence, they are not considered in Paron & Giacani (2010) and they are not included in our Fig. 1 either. In our model, shown below, they are assumed to be located far from the SNR.
Noticeably, a H I shell sometimes could be associated with a pre-SN wind bubble or a SNR; see, for example, the slow-expanding H I shell around the Wolf-Rayet star HD 156385 (Cappa de Nicolau et al. 1988) and the fast-expanding H I shells around SNR CTB 80 (Park et al. 2013) & SNR Cygnus Loop (Leahy 2003). Finding such a shell could help us to confine the progenitor type and the ambient density, which eventually leads to a more accurate SNR age. Unfortunately, H I shells are very difficult to find and only several are known among all ~ 300 Galactic SNRs (Leahy & Ranasinghe 2012). We revisited the H I data used in Zhu et al. (2013) and we do not find any evidence for either a slow or a fast H I shell around SNR G35.6−0.4.
As seen in Fig. 3, the GeV source SrcX1 lacks multi-wavelength counterparts and no X-ray source, TeV source, pulsar, or H II region is located within the 2σ uncertainty circle. Hence, SrcX1 will be considered as a background source in this work.
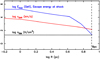 |
Fig. 4 SNR evolution profiles. The radial profiles of the circumstellar density, shock velocity, and the escape energy are shown in black, red, and blue lines, respectively. |
4 A hadronic explanation of GeV-TeV emission of HESS J1858+020
4.1 Models
As described in the previous section, one of the most challenging characteristics of the γ-ray spectrum of SrcX2 is the broad energy range. A successful acceleration model for such a spectrum should be able to release the ≳ 100 TeV CRs during its early SNR stage, as well as the 10−100 GeV CRs during its late SNR stage.
A simple SNR evolution history with a homogeneous circumstellar medium is adopted in our model. To calculate the SNR evolution history, the analytical solution of vSNR ∝ t−3∕7 (Chevalier 1982; Nadezhin 1985) was adopted for the ejecta-dominated stage, while the thin-shell approximation (Ptuskin & Zirakashvili 2005) was adopted for the Sedov-Taylor stage; the result is essentially consistent with the analytical solution of vSNR ∝ t−3∕5 (Ostriker & McKee 1988; Bisnovatyi-Kogan & Silich 1995) and the analytical solution of vSNR ∝ t−7∕10 by Cioffi et al. (1988) is adopted for the pressure-driven snowplow (PDS) stage. The SNR evolution profiles are shown in Fig. 4.
In explaining the hard TeV tail of SrcX2, we adopt the acceleration theory of nonresonant streaming instability developed by Bell (2004) and Zirakashvili & Ptuskin (2008). This theory can boost the escape energy up to hundreds of TeV in young SNRs. Given a SNR’s evolution history and an acceleration efficiency, an analytical approximation of this theory (Zirakashvili & Ptuskin 2008) can provide us with the runaway CR flux J and the escape energy Emax. In a strong shock, only CRs with energies above Emax can escape from the shock upstream and become runaway CRs. A magnetic field of B0 = 5μG and an initial magnetic fluctuation of Bb = 7% B0 in the ICM are assumed in the calculation, following Zirakashvili & Ptuskin (2008).
In explaining the GeV spectrum of SrcX2, the damping of the magnetic waves by the neutrals is adopted in the late SNR stage. This damping effect can significantly lower Emax and it is considered important in mid-aged and old SNRs; both Shull & McKee (1979) and Sutherland & Dopita (2017) noted that a shock slower than ~100 km s−1 will lead to a significant drop of the UV ionization at shock precursor. The relationship of  TeV (O’C Drury et al. 1996) is adopted to estimate the escape energy in partially ionized medium, where v3 is shock velocity in unit of 103 km s−1, nH is the circumstellar density, and nn is the neutral density. A homogeneous diffusion coefficient was adopted in the entire space, which follows a power-law rule of D = D10Eδ. By integrating the SNR surface as well as the entire SNR evolution history, it is possible to obtain the present CR density at CloudX2; see also the equations in Sect. 2.4.1 of Cui et al. (2016).
4.2 Parameter justifications and results
The escape energy Emax is highly sensitive to the shock velocity, vSNR. To generate ~10 GeV CRs, one requires a shock velocity of vSNR ≪ 1000 km s−1 during the late stage of the SNR evolution. Hence, we adopt a relative high circumstellar density of nH = 20 H cm−3. Such a density at a Galactocentric distance of 5 kpc indicate that the circumstellar medium is cold neutral medium (Wolfire et al. 2003; Cox 2005). When the SNR reaches 8 pc, our model gives a SNR age of tSNR = 18 kyr, a shock velocity of vSNR = 142 km s−1, and an escape energy of Emax = 26 GeV, see Fig. 4.
More details of the best fitted parameters are shown in Table 2, where we also show the dependencies of our fitting results on those parameters. A higher Eej gives a overall higher vSNR. Both a higher vSNR and a higher η can eventually leads to a higher total CR production and a higher escape energy Emax. The value of Eej is suggested to be around  . The value of η is limited by that the energy of total accelerated CRs should not be too far from 10%Eej. A lower diffusion coefficient, D, and longer SNR-cloud distance, L, will suppress the CRs (mostly GeV CRs) from reaching CloudX2. However, once the CRs can easily reach the cloud (mean diffusion distance after certain time is beyond the SNR-cloud distance L), a lower diffusion coefficient helps confining the CRs in the SNR-cloud region from spreading too thin.
The neutral density nn in the shock precursor lacks observational constraints. Following the recent simulation work (Fig. 5 in Sutherland & Dopita 2017), we adopt an estimation of  in a range ofvSNR = 140−500 km s−1, where X = nn∕nH and 1 − X is the ionization ratio. In a more detailed model, for a future study, X is dependent on many other factors, such as metallicity or magnetic field; see also Sutherland & Dopita (2017). The damping of magnetic waves takes effect when the shock velocity is below ~ 500 km s−1, and this 500 km s−1 is chosen to get a smooth transition from the theory of Zirakashvili & Ptuskin (2008) to that of O’C Drury et al. (1996).
Using the nonresonate acceleration model in the early stage and the damping model in the late stage, over the entire SNR evolution, the runaway CRs cover a large energy range, from ~ 10 GeV up to more than 100 TeV, see Fig. 4. To explain the flat GeV-TeV spectrum of SrcX2, the early released TeV CRs should not diffuse too far at an age of 18 kyr, meanwhile the late-released GeV CRs should be able to reach CloudX2. Hence, a relative hard index of diffusion coefficient (0.25) is adopted; see also Table 2. Ultimately, these SNR CRs explain the GeV-TeV emission of SrcX2 with a diffusion coefficient that is much lower than the Galacticvalue; see the spectrum fitting in Fig. 5. The SNR has a Galactocentric distance of 5 kpc, while the corresponding CR sea contribution (Yang et al. 2016; Acero et al. 2016) is very little and can be ignored.
Parameters of the SNR model.
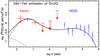 |
Fig. 5 Hadronic model results using SNR CRs in explaining the GeV-TeV emission of SrcX2. The Fermi-LAT data and HESS data of SrcX2 are marked in red and blue, respectively. Our model results are shown in solid lines, the contribution of runaway CRs and CR sea are marked in dashed lines and dotted lines,respectively. |
5 Discussions and observational expectations
One of the arguments in support of SNR G35.6−0.4 as a middle-aged SNR is the non-detection of diffuse X-ray emission with Chandra. More sensitive observations with XMM-Newton may solve this question by detecting either the thermal or the non-thermal emission. For instance, the thermal emission found in SNR W28 with XMM-Newton (Zhou et al. 2014) shows a temperature of ~ 0.5 keV with a column density of ~4 × 10²¹ H cm−2. The column density at SNR G35.6−0.4 is ~ 1.44 × 10²² H cm−2. Future X-ray observations may also discover the alternative power sources if they are leptonic dominated – for example, a PWN origin for HESS J1640-465 (Xin et al. 2018) – as well as the potential shock-cloud collisions – for example, the thermal X-ray emission at the northeastern shell of SNR W28 (Zhou et al. 2014). Noticeably, millimeter observations of ionization lines may also shed some light on the shock-cloud collisions.
One of the most interesting feature of SrcX2 is the hard TeV tail and we expect future observations with LHAASO/CTA may further characterize the hard tail (see Fig. 2). In addition, they may also reveal more detailed TeV features at or around the SNR.
6 Summary
We carried out an analysis the Fermi-LAT data at SNR G35.6−0.4 and discovered two GeV sources using the >5 GeV data. A soft GeV source – SrcX1 is located at the northern edge of the SNR, a hard GeV source – SrcX2 is in spatial coincident with HESS J1858+020 and the molecular cloud complex at east – CloudX2. The spectral index of SrcX1 and SrcX2 are 3.09 ± 0.09 and 2.27 ± 0.14, respectively.The GeV spectrum of SrcX2 connects well with the TeV spectrum of HESS J1858+020. The entire GeV-TeV spectrum of SrcX2 is flat and it covers a wide energy range, from several GeV up to tens of TeV.
We find that SNR G35.6−0.4 is possibly a middle-aged SNR, and this argument is supported by three pieces of indirect observational evidence. Firstly, we find that the lack of diffuse X-ray emission, especially for the keV band, is likely due to an intrinsic weak source rather than the heavy absorption. Secondly, if the SrcX2 is indeed powered by the SNR CRs, then the GeV emission found at CloudX2 indicates that CRs with energies down to ~ 10 GeV have been released from the SNR. Thirdly, the radio index of SNR G35.6−0.4 is much harder than that of a young SNR. However, this evidence is not conclusive and we look forward to future observations of SNR G35.6−0.4.
We built a hadronic model to explain the GeV-TeV emission of SrcX2 with SNR CRs. By adopting the acceleration theory of nonresonant streaming instability, our model can generate CRs with energies of ≳ 100 TeV during the early SNR stage. The damping of magnetic waves by the neutrals was adopted for the late SNR stage and it leads to the release of CRs with energies down to ~10 GeV. Our model requires a diffusion coefficient that is much lower than the Galactic value and, in particular, a hard index of diffusion coefficients is needed to suppress the diffusion of early-released TeV CRs.
Acknowledgements
We like to thank Guangxing Li, Wenwu Tian for discussions on radio studies of SNR G35.6−0.4. Yudong Cui & P. H. Thomas Tam are supported by the Fundamental Research Funds for the Central Universities grant (20lgpy170) and the National Science Foundation of China (NSFC) grants (11633007, 11661161010, and U1731136). Yuliang Xin is supported by the Natural Science Foundation for Young Scholars of Jiangsu Province, China (No. BK20191109). Siming Liu is supported by NSFC (No. U1738122, U1931204) and the International Partnership Program of Chinese Academy of Sciences (No.114332KYSB20170008). Hui Zhu is supported by National Key R&D Program of China (2018YFA0404203) and NSFC (11603039).
References
- Abeysekara, A. U., Albert, A., Alfaro, R., et al. 2017, ApJ, 843, 40 [NASA ADS] [CrossRef] [Google Scholar]
- Abdo, A. A., Ackermann, M., Ajello, M., et al. 2010, ApJ, 718, 348 [NASA ADS] [CrossRef] [Google Scholar]
- Acero, F., Ackermann, M., Ajello, M., et al. 2016, ApJS, 223, 26 [NASA ADS] [CrossRef] [EDP Sciences] [Google Scholar]
- Abdollahi, S., Acero, F., Ackermann, M., et al. 2020, ApJS, 247, 33 [NASA ADS] [CrossRef] [Google Scholar]
- Aharonian, F., Akhperjanian, A. G., Barres de Almeida, U., et al. 2008, A&A, 477, 353 [NASA ADS] [CrossRef] [EDP Sciences] [Google Scholar]
- Bai, X., Bi, B. Y., Bi, X. J., et al. 2019, ArXiv eprints [arXiv:1905.02773] [Google Scholar]
- Bell, A. R. 2004, MNRAS, 353, 550 [Google Scholar]
- Bisnovatyi-Kogan, G. S., & Silich, S. A. 1995, Rev. Mod. Phys., 67, 661 [NASA ADS] [CrossRef] [Google Scholar]
- Cappa de Nicolau, C. E., Niemela, V. S., Dubner, G. M., et al. 1988, AJ, 96, 1671 [NASA ADS] [CrossRef] [Google Scholar]
- Chevalier, R. A. 1982, ApJ, 259, 302 [NASA ADS] [CrossRef] [Google Scholar]
- Cioffi, D. F., McKee, C. F., & Bertschinger, E. 1988, ApJ, 334, 252 [NASA ADS] [CrossRef] [Google Scholar]
- Cox, D. P. 2005, ARA&A, 43, 337 [NASA ADS] [CrossRef] [EDP Sciences] [MathSciNet] [Google Scholar]
- CTA Consortium 2019, Science with the Cherenkov Telescope Array (Singapore: World Scientific) [Google Scholar]
- Cui, Y., Pühlhofer, G., & Santangelo, A. 2016, A&A, 591, A68 [NASA ADS] [CrossRef] [EDP Sciences] [Google Scholar]
- Cui, Y., Yeung, P. K. H., Tam, P. H. T., & Pühlhofer, G. 2018, ApJ, 860, 69 [Google Scholar]
- Cui, Y., Yang,R., He, X., et al. 2019, ApJ, 887, 47 [Google Scholar]
- Dubner, G., & Giacani, E. 2015, A&ARv, 23, 3 [NASA ADS] [CrossRef] [EDP Sciences] [Google Scholar]
- Green, D. A. 2009, MNRAS, 399, 177 [NASA ADS] [CrossRef] [Google Scholar]
- Green, G. M., Schlafly, E., Zucker, C., et al. 2019, ApJ, 887, 93 [NASA ADS] [CrossRef] [Google Scholar]
- Hanabata, Y., Katagiri, H., Hewitt, J. W., et al. 2014, ApJ, 786, 145 [NASA ADS] [CrossRef] [Google Scholar]
- Han, J. L., Manchester, R. N., Lyne, A. G., et al. 2006, ApJ, 642, 868 [NASA ADS] [CrossRef] [Google Scholar]
- H.E.S.S. Collaboration (Abdalla, H., et al.) 2018, A&A, 612, A1 [NASA ADS] [CrossRef] [EDP Sciences] [Google Scholar]
- Leahy, D. A. 2003, ApJ, 586, 224 [Google Scholar]
- Leahy, D. A., & Ranasinghe, S. 2012, MNRAS, 423, 718 [NASA ADS] [CrossRef] [Google Scholar]
- MAGIC Collaboration (Aleksić, J., et al.) 2014, A&A, 571, A96 [EDP Sciences] [Google Scholar]
- Mattox, J. R., Bertsch, D. L., Chiang, J., et al. 1996, ApJ, 461, 396 [NASA ADS] [CrossRef] [Google Scholar]
- Morris, D. J., Hobbs, G., Lyne, A. G., et al. 2002, MNRAS, 335, 275 [NASA ADS] [CrossRef] [Google Scholar]
- Nadezhin, D. K. 1985, Ap&SS, 112, 225 [NASA ADS] [CrossRef] [Google Scholar]
- O’C Drury, L., Duffy, P., & Kirk, J. G. 1996, A&A, 309, 1002 [NASA ADS] [Google Scholar]
- Ostriker, J. P., & McKee, C. F. 1988, Rev. Mod. Phys., 60, 1 [NASA ADS] [CrossRef] [Google Scholar]
- Paredes, J. M., Ishwara-Chandra, C. H., Bosch-Ramon, V., et al. 2014, A&A, 561, A56 [NASA ADS] [CrossRef] [EDP Sciences] [Google Scholar]
- Park, G., Koo,B.-C., Gibson, S. J., et al. 2013, ApJ, 777, 14 [NASA ADS] [CrossRef] [Google Scholar]
- Paron, S., & Giacani, E. 2010, A&A, 509, L4 [NASA ADS] [CrossRef] [EDP Sciences] [Google Scholar]
- Paron, S., Giacani, E., Rubio, M., & Dubner, G. 2011, A&A, 530, A25 [NASA ADS] [CrossRef] [EDP Sciences] [Google Scholar]
- Phillips, J. A., & Onello, J. S. 1993, ASP Conf. Ser., 35, 419 [Google Scholar]
- Ptuskin, V. S., & Zirakashvili, V. N. 2005, A&A, 429, 755 [NASA ADS] [CrossRef] [EDP Sciences] [MathSciNet] [PubMed] [Google Scholar]
- Ranasinghe, S., & Leahy, D. A. 2018, AJ, 155, 204 [NASA ADS] [CrossRef] [Google Scholar]
- Sutherland, R. S., & Dopita, M. A. 2017, ApJS, 229, 34 [NASA ADS] [CrossRef] [Google Scholar]
- Stil, J. M., Taylor, A. R., Dickey, J. M., et al. 2006, AJ, 132, 1158 [Google Scholar]
- Shull, J. M., & McKee, C. F. 1979, ApJ, 227, 131 [NASA ADS] [CrossRef] [Google Scholar]
- Tang, Y., Yang, C., Zhang, L., et al. 2015, ApJ, 812, 32 [NASA ADS] [CrossRef] [Google Scholar]
- Torres, D. F., Li, H., Chen, Y., et al. 2011, MNRAS, 417, 3072 [NASA ADS] [CrossRef] [Google Scholar]
- Willingale, R., Starling, R. L. C., Beardmore, A. P., Tanvir, N. R., & O’Brien, P. T. 2013, MNRAS, 431, 394 [NASA ADS] [CrossRef] [Google Scholar]
- Wolfire, M. G., McKee, C. F., Hollenbach, D., & Tielens, A. G. G. M. 2003, ApJ, 587, 278 [NASA ADS] [CrossRef] [Google Scholar]
- Xin, Y.-L., Liao, N.-H., Guo, X.-L., et al. 2018, ApJ, 867, 55 [Google Scholar]
- Yang, R., Aharonian, F., & Evoli, C. 2016, Phys. Rev. D, 93, 123007 [Google Scholar]
- Zhou, P., Safi-Harb, S., Chen, Y., et al. 2014, ApJ, 791, 87 [NASA ADS] [CrossRef] [Google Scholar]
- Zhu, H., Tian, W. W., Torres, D. F., et al. 2013, ApJ, 775, 95 [NASA ADS] [CrossRef] [Google Scholar]
- Zhu, H., Tian, W., Li, A., et al. 2017, MNRAS, 471, 3494 [NASA ADS] [CrossRef] [Google Scholar]
- Zirakashvili, V. N., & Ptuskin, V. S. 2008, ApJ, 678, 939 [NASA ADS] [CrossRef] [Google Scholar]
All Tables
Best-fit position, spectral parameters, and TS values of SrcX1/SrcX2 for different energy bands with point source assumptions.
All Figures
|
Fig. 1 TS maps for photons above 5 GeV(top) and 10 GeV(bottom) are shown. Both of the maps are smoothed with a σ = 0.03° Gaussian kernel. The PSF of a single 5 GeV/10 GeV photon is also shown in dashed yellow circles. The red cross and circle show a point source – 4FGL J1855.8+0150 and an extended source – 4FGL J1857.7+0246e, respectively. The two black crosses represent two point sources – 4FGL J1858.3+0209 and 4FGL J1857.6+0212. The diamonds represent “SrcX1” and “SrcX2”, which are the best fitted position of the two sources discovered in our analysis. Bottom panel: 1σ error radius of SrcX1 and SrcX2 are also shown in dashed circles. The cyan dashed circle in the top panel shows the TeV extension of HESS J1857+026, which is adopted to be one of the spatial templates. The cyan contours and white circle represent the MAGIC image and the H.E.S.S. image, respectively. The green contours show the VGPS data at 1.4 GHz with an arcminute resolution, and the magenta contours display the 13CO J = 1–0 emission for CloudX2. In both panels, the x-axis are the right ascension (RA), and the y-axis are the declination (Dec). |
| In the text | |
|
Fig. 2 Fermi-LAT SED of SrcX1 (black dots) and SrcX2 (blue dots), with arrows indicating the 95% upper limits. Red dots represent the HESS observation of HESS J1858+020 (Aharonian et al. 2008). Gray butterfly indicates the best-fit power-law of SrcX1 in the energy range of 1–500 GeV. Solid green line is the joint fit for the Fermi-LAT data of SrcX2 and HESS data of HESS J1858+020. The cyan dotted and dot-dashed lines show the differential sensitivities of LHAASO (1 yr) with different sizes of photomultiplier tube (PMT; Bai et al. 2019). Black dotted line represents the differential sensitivity of CTA-North (50 h; CTA Consortium 2019). |
| In the text | |
|
Fig. 3 13 CO map around SNR G35.6−0.4 is shown, where the CO data is obtained from GRS. The x-axis and y-axis represent the RA and Dec, respectively. Noticeably, only the contours of CloudX2 is shown in Fig. 1, meanwhile the western clouds that lack γ-ray counterparts are neglected in this work. The 1.4 GHz image from VGPS is marked in green contours. The best fitted position of SrcX1 and SrcX2 are marked in red diamonds, red circles represent their position uncertainties (2σ). The X-ray point sources and the nearby pulsars are marked in white crosses and circles, respectively. The H II region G35.6−0.5 and the planetary nebulae PN G35.5−0.4 are marked in cyan boxes. |
| In the text | |
|
Fig. 4 SNR evolution profiles. The radial profiles of the circumstellar density, shock velocity, and the escape energy are shown in black, red, and blue lines, respectively. |
| In the text | |
|
Fig. 5 Hadronic model results using SNR CRs in explaining the GeV-TeV emission of SrcX2. The Fermi-LAT data and HESS data of SrcX2 are marked in red and blue, respectively. Our model results are shown in solid lines, the contribution of runaway CRs and CR sea are marked in dashed lines and dotted lines,respectively. |
| In the text | |
Current usage metrics show cumulative count of Article Views (full-text article views including HTML views, PDF and ePub downloads, according to the available data) and Abstracts Views on Vision4Press platform.
Data correspond to usage on the plateform after 2015. The current usage metrics is available 48-96 hours after online publication and is updated daily on week days.
Initial download of the metrics may take a while.