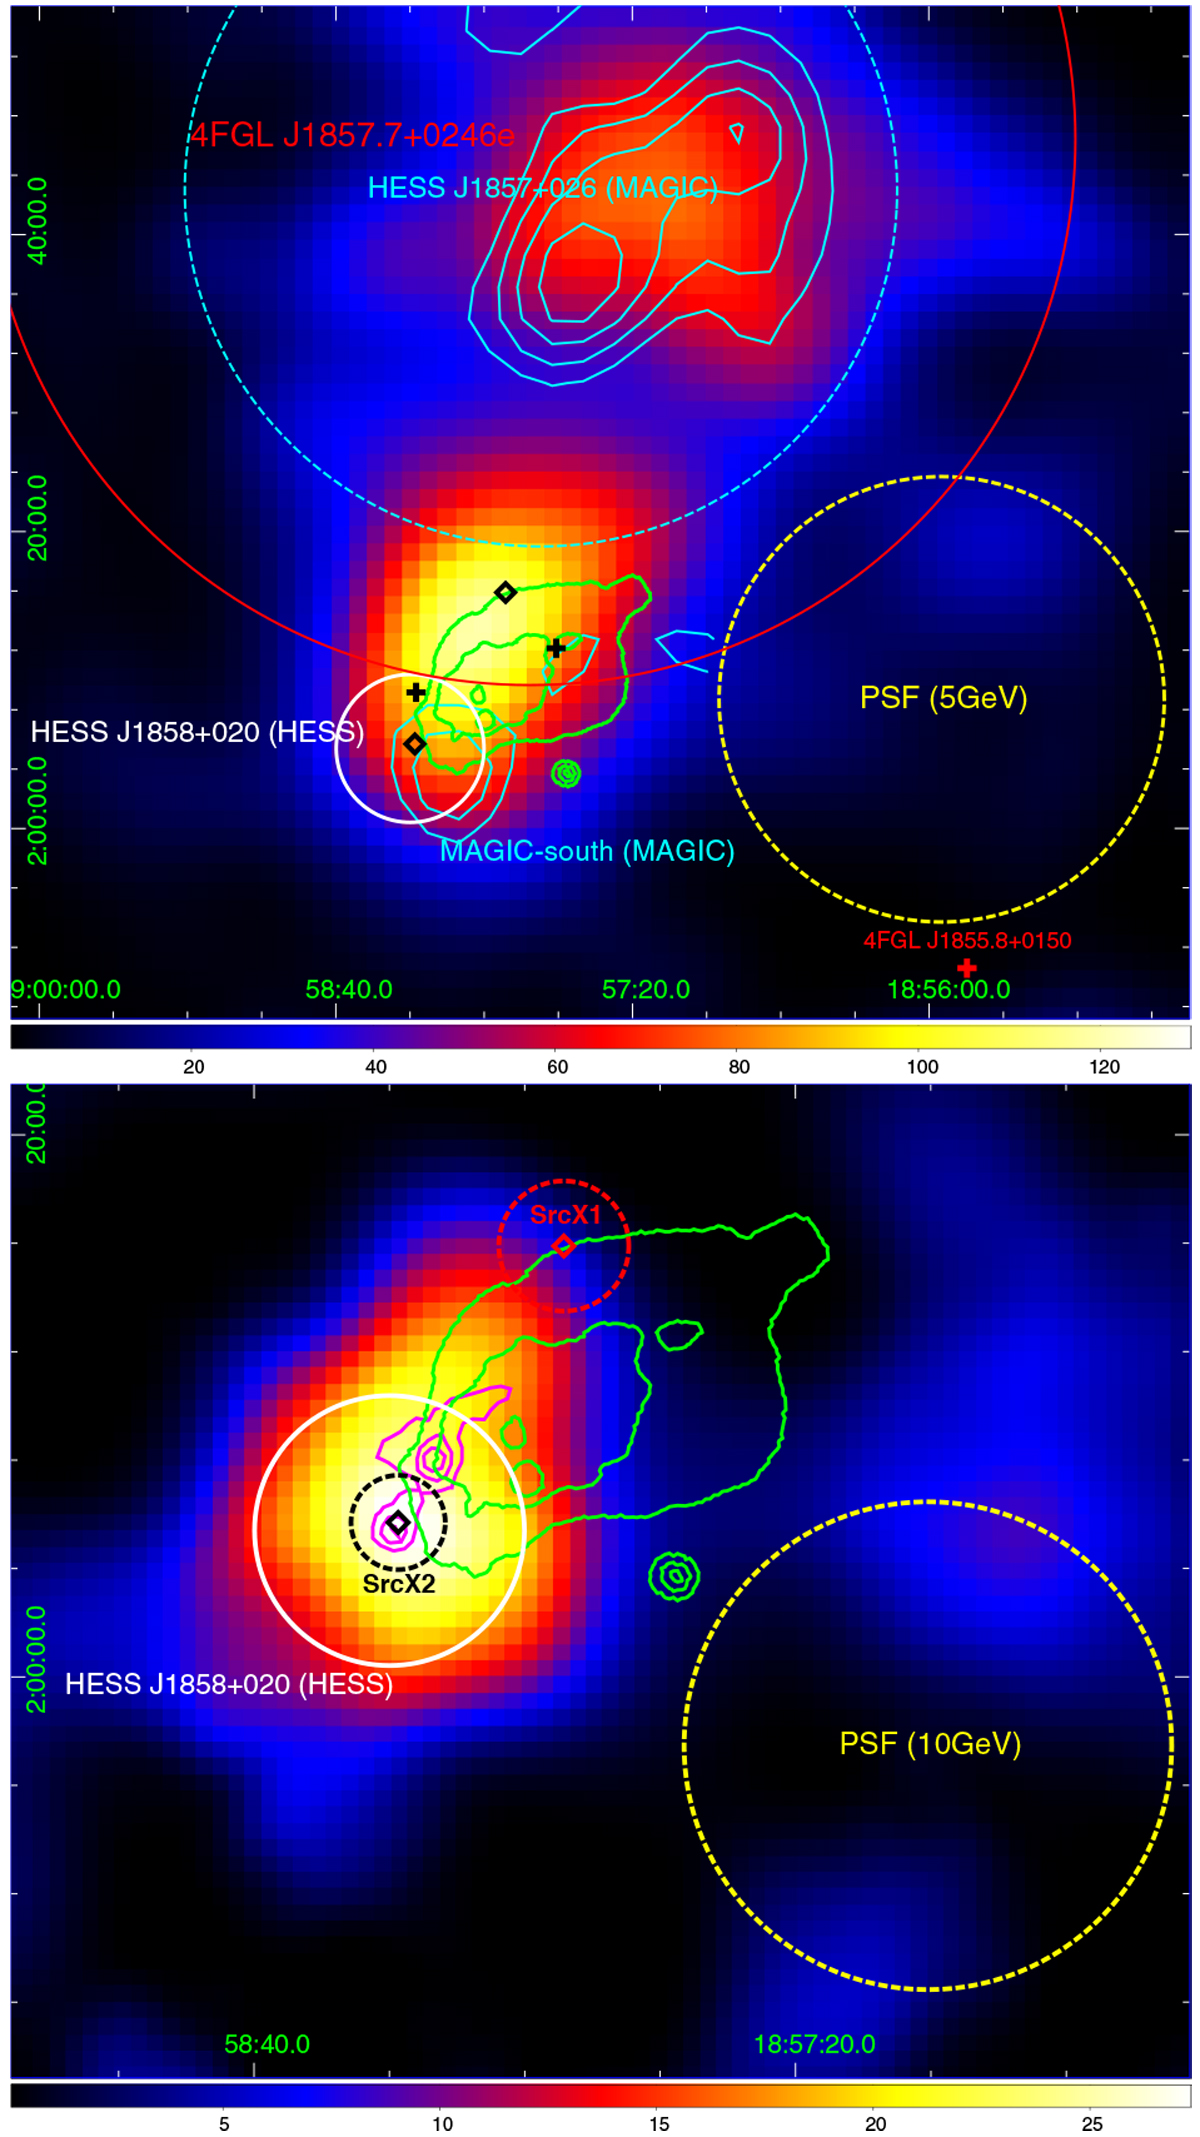
Fig. 1

TS maps for photons above 5 GeV(top) and 10 GeV(bottom) are shown. Both of the maps are smoothed with a σ = 0.03° Gaussian kernel. The PSF of a single 5 GeV/10 GeV photon is also shown in dashed yellow circles. The red cross and circle show a point source – 4FGL J1855.8+0150 and an extended source – 4FGL J1857.7+0246e, respectively. The two black crosses represent two point sources – 4FGL J1858.3+0209 and 4FGL J1857.6+0212. The diamonds represent “SrcX1” and “SrcX2”, which are the best fitted position of the two sources discovered in our analysis. Bottom panel: 1σ error radius of SrcX1 and SrcX2 are also shown in dashed circles. The cyan dashed circle in the top panel shows the TeV extension of HESS J1857+026, which is adopted to be one of the spatial templates. The cyan contours and white circle represent the MAGIC image and the H.E.S.S. image, respectively. The green contours show the VGPS data at 1.4 GHz with an arcminute resolution, and the magenta contours display the 13CO J = 1–0 emission for CloudX2. In both panels, the x-axis are the right ascension (RA), and the y-axis are the declination (Dec).
Current usage metrics show cumulative count of Article Views (full-text article views including HTML views, PDF and ePub downloads, according to the available data) and Abstracts Views on Vision4Press platform.
Data correspond to usage on the plateform after 2015. The current usage metrics is available 48-96 hours after online publication and is updated daily on week days.
Initial download of the metrics may take a while.


