Fig. 2
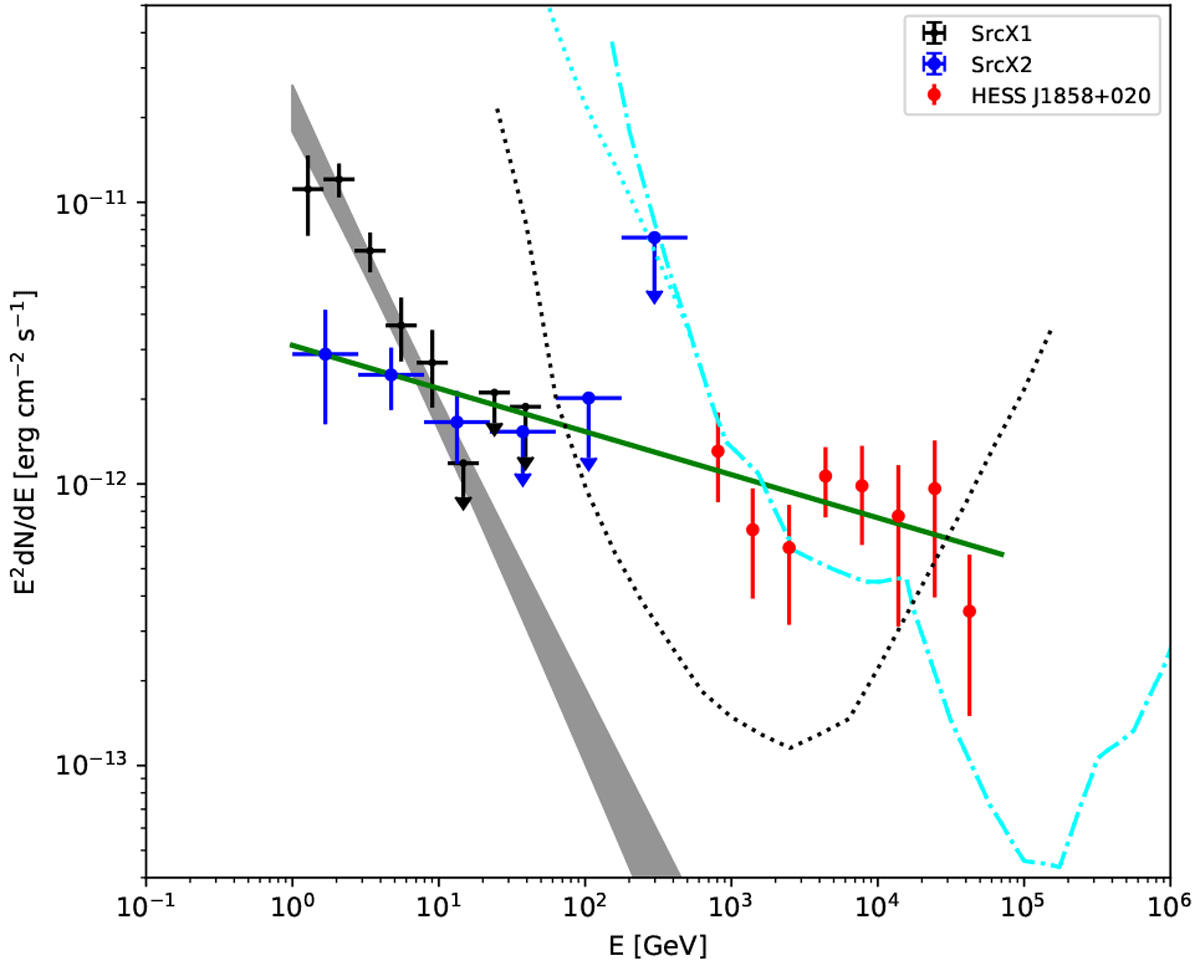
Fermi-LAT SED of SrcX1 (black dots) and SrcX2 (blue dots), with arrows indicating the 95% upper limits. Red dots represent the HESS observation of HESS J1858+020 (Aharonian et al. 2008). Gray butterfly indicates the best-fit power-law of SrcX1 in the energy range of 1–500 GeV. Solid green line is the joint fit for the Fermi-LAT data of SrcX2 and HESS data of HESS J1858+020. The cyan dotted and dot-dashed lines show the differential sensitivities of LHAASO (1 yr) with different sizes of photomultiplier tube (PMT; Bai et al. 2019). Black dotted line represents the differential sensitivity of CTA-North (50 h; CTA Consortium 2019).
Current usage metrics show cumulative count of Article Views (full-text article views including HTML views, PDF and ePub downloads, according to the available data) and Abstracts Views on Vision4Press platform.
Data correspond to usage on the plateform after 2015. The current usage metrics is available 48-96 hours after online publication and is updated daily on week days.
Initial download of the metrics may take a while.