Fig. 3
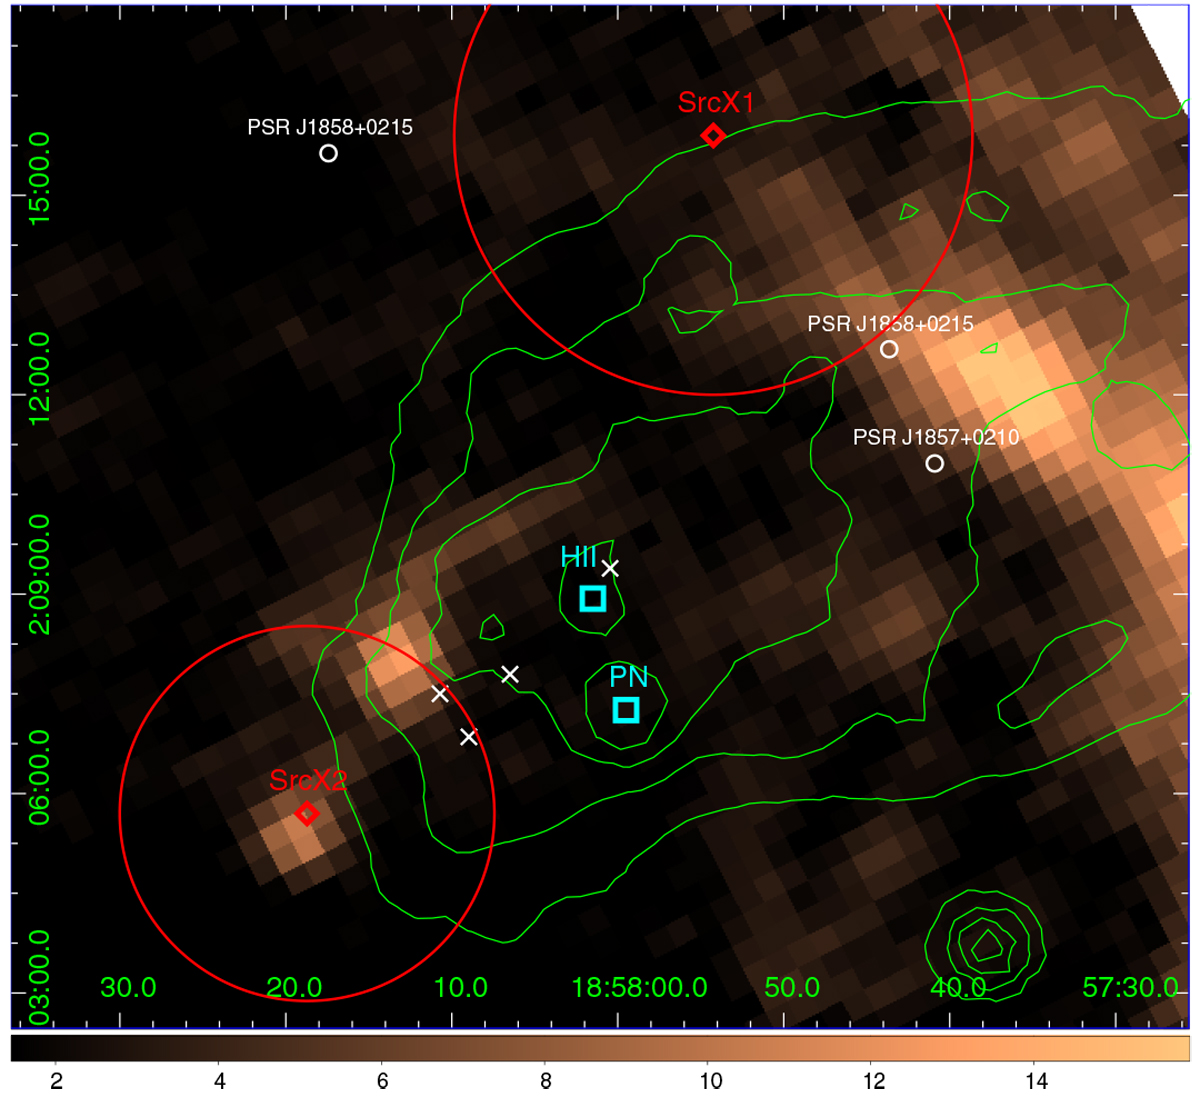
13 CO map around SNR G35.6−0.4 is shown, where the CO data is obtained from GRS. The x-axis and y-axis represent the RA and Dec, respectively. Noticeably, only the contours of CloudX2 is shown in Fig. 1, meanwhile the western clouds that lack γ-ray counterparts are neglected in this work. The 1.4 GHz image from VGPS is marked in green contours. The best fitted position of SrcX1 and SrcX2 are marked in red diamonds, red circles represent their position uncertainties (2σ). The X-ray point sources and the nearby pulsars are marked in white crosses and circles, respectively. The H II region G35.6−0.5 and the planetary nebulae PN G35.5−0.4 are marked in cyan boxes.
Current usage metrics show cumulative count of Article Views (full-text article views including HTML views, PDF and ePub downloads, according to the available data) and Abstracts Views on Vision4Press platform.
Data correspond to usage on the plateform after 2015. The current usage metrics is available 48-96 hours after online publication and is updated daily on week days.
Initial download of the metrics may take a while.