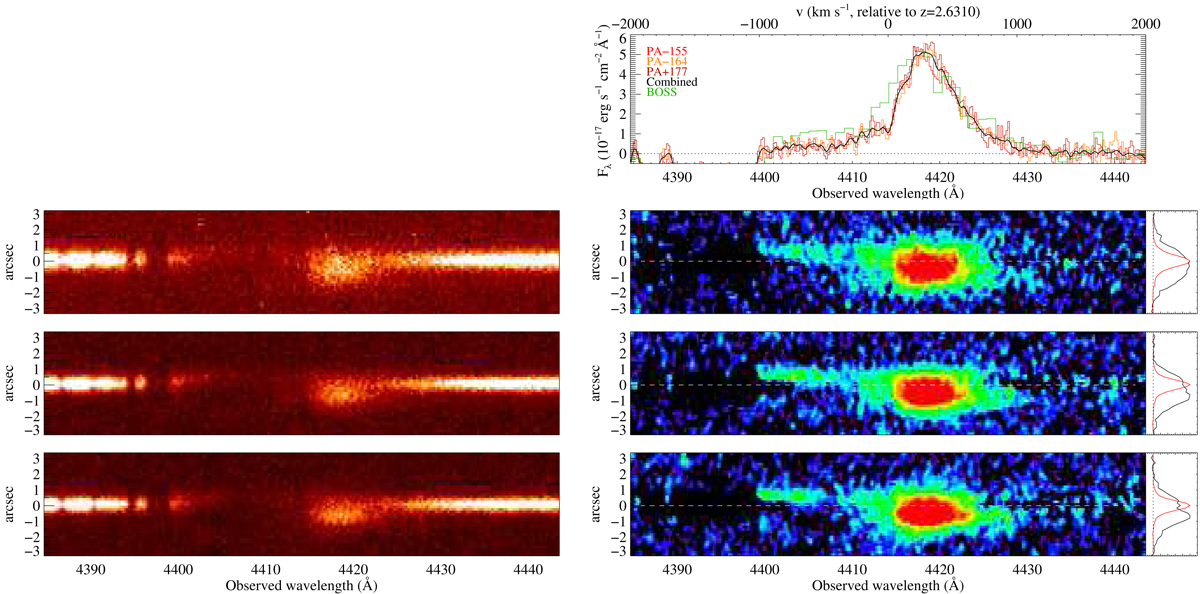
Fig. 9.

Ly-α emission in PDLA core before (left) and after (right) subtraction of the unresolved quasar continuum emission. From top to bottom: PAs = −155, −164 and +177 deg. Top-right panel: spectral profile of the extended Ly-α emission for each position angle as well as their average, collapsing over the full spatial range shown in the 2D panels (hence an aperture of 6 × 1 arcsec). The SDSS-III/BOSS spectrum is shown in green. The small side panels show the spatial profiles of the unresolved quasar continuum emission (red) and the extended Ly-α emission (black).
Current usage metrics show cumulative count of Article Views (full-text article views including HTML views, PDF and ePub downloads, according to the available data) and Abstracts Views on Vision4Press platform.
Data correspond to usage on the plateform after 2015. The current usage metrics is available 48-96 hours after online publication and is updated daily on week days.
Initial download of the metrics may take a while.


