Fig. 8.
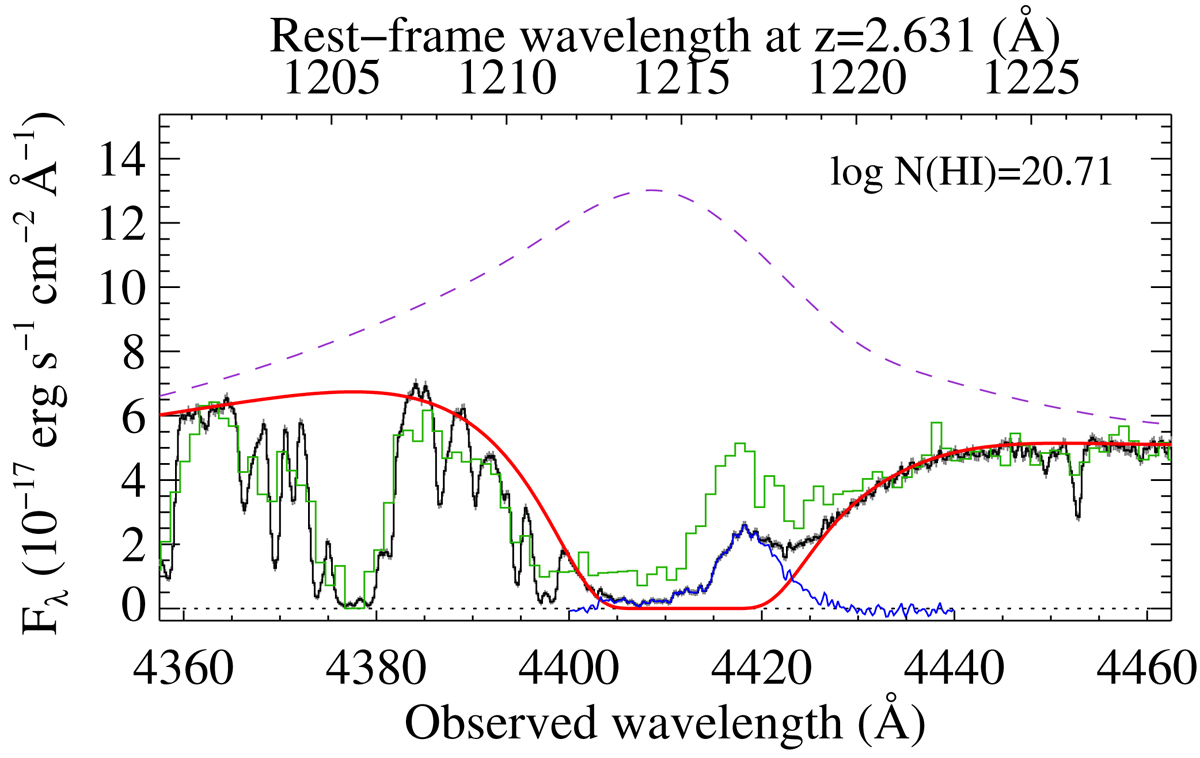
Decomposition of rest-frame Ly-α region. The observed on-trace X-shooter spectrum is shown in black with uncertainties as grey error bars. The reconstructed unabsorbed quasar emission line is shown as the dashed purple curve. The red curve is the combination of this unabsorbed emission together with the modelled DLA absorption profile with log N(H I) = 20.71. Subtracting the absorption profile from the intrinsic emission profile provides us with the residual emission shown in blue, over the 4400−4440 Å wavelength interval. The BOSS fibre spectrum is shown in green.
Current usage metrics show cumulative count of Article Views (full-text article views including HTML views, PDF and ePub downloads, according to the available data) and Abstracts Views on Vision4Press platform.
Data correspond to usage on the plateform after 2015. The current usage metrics is available 48-96 hours after online publication and is updated daily on week days.
Initial download of the metrics may take a while.