Open Access
Fig. 7.
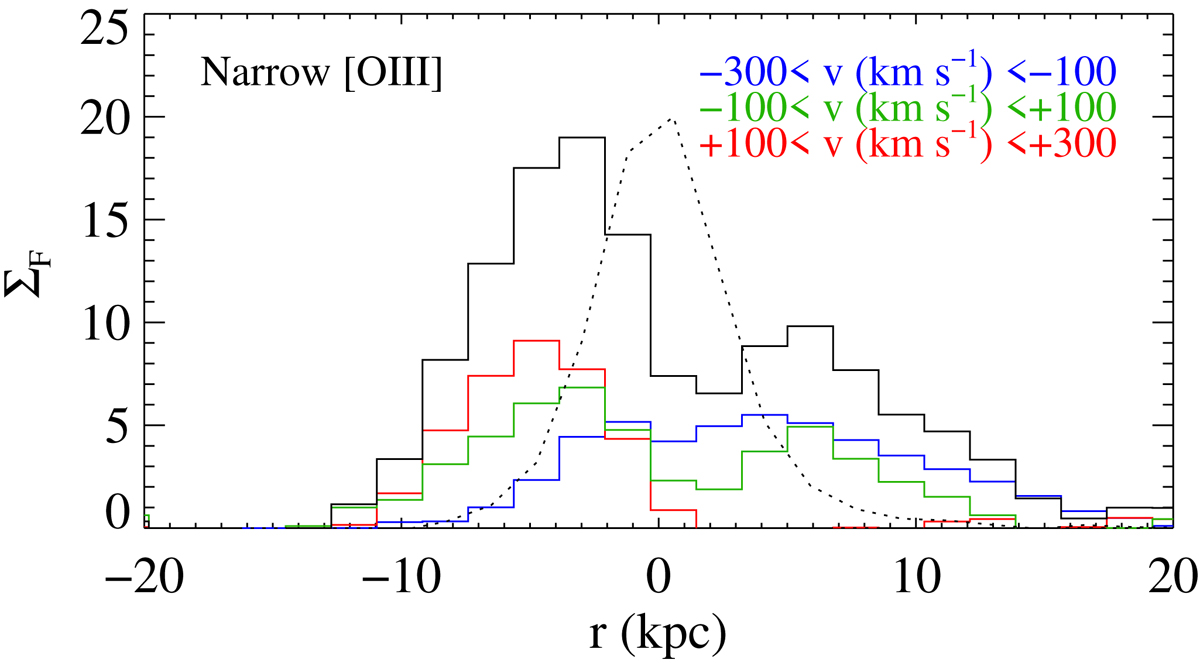
Total spatial profile of narrow [O III] emission (black) and in three velocity bins (with colours indicated in the legend) after subtracting the unresolved broad [O III] and continuum emission. The dotted line shows the spectral PSF obtained from the trace of the quasar continuum.
Current usage metrics show cumulative count of Article Views (full-text article views including HTML views, PDF and ePub downloads, according to the available data) and Abstracts Views on Vision4Press platform.
Data correspond to usage on the plateform after 2015. The current usage metrics is available 48-96 hours after online publication and is updated daily on week days.
Initial download of the metrics may take a while.