Fig. 5.
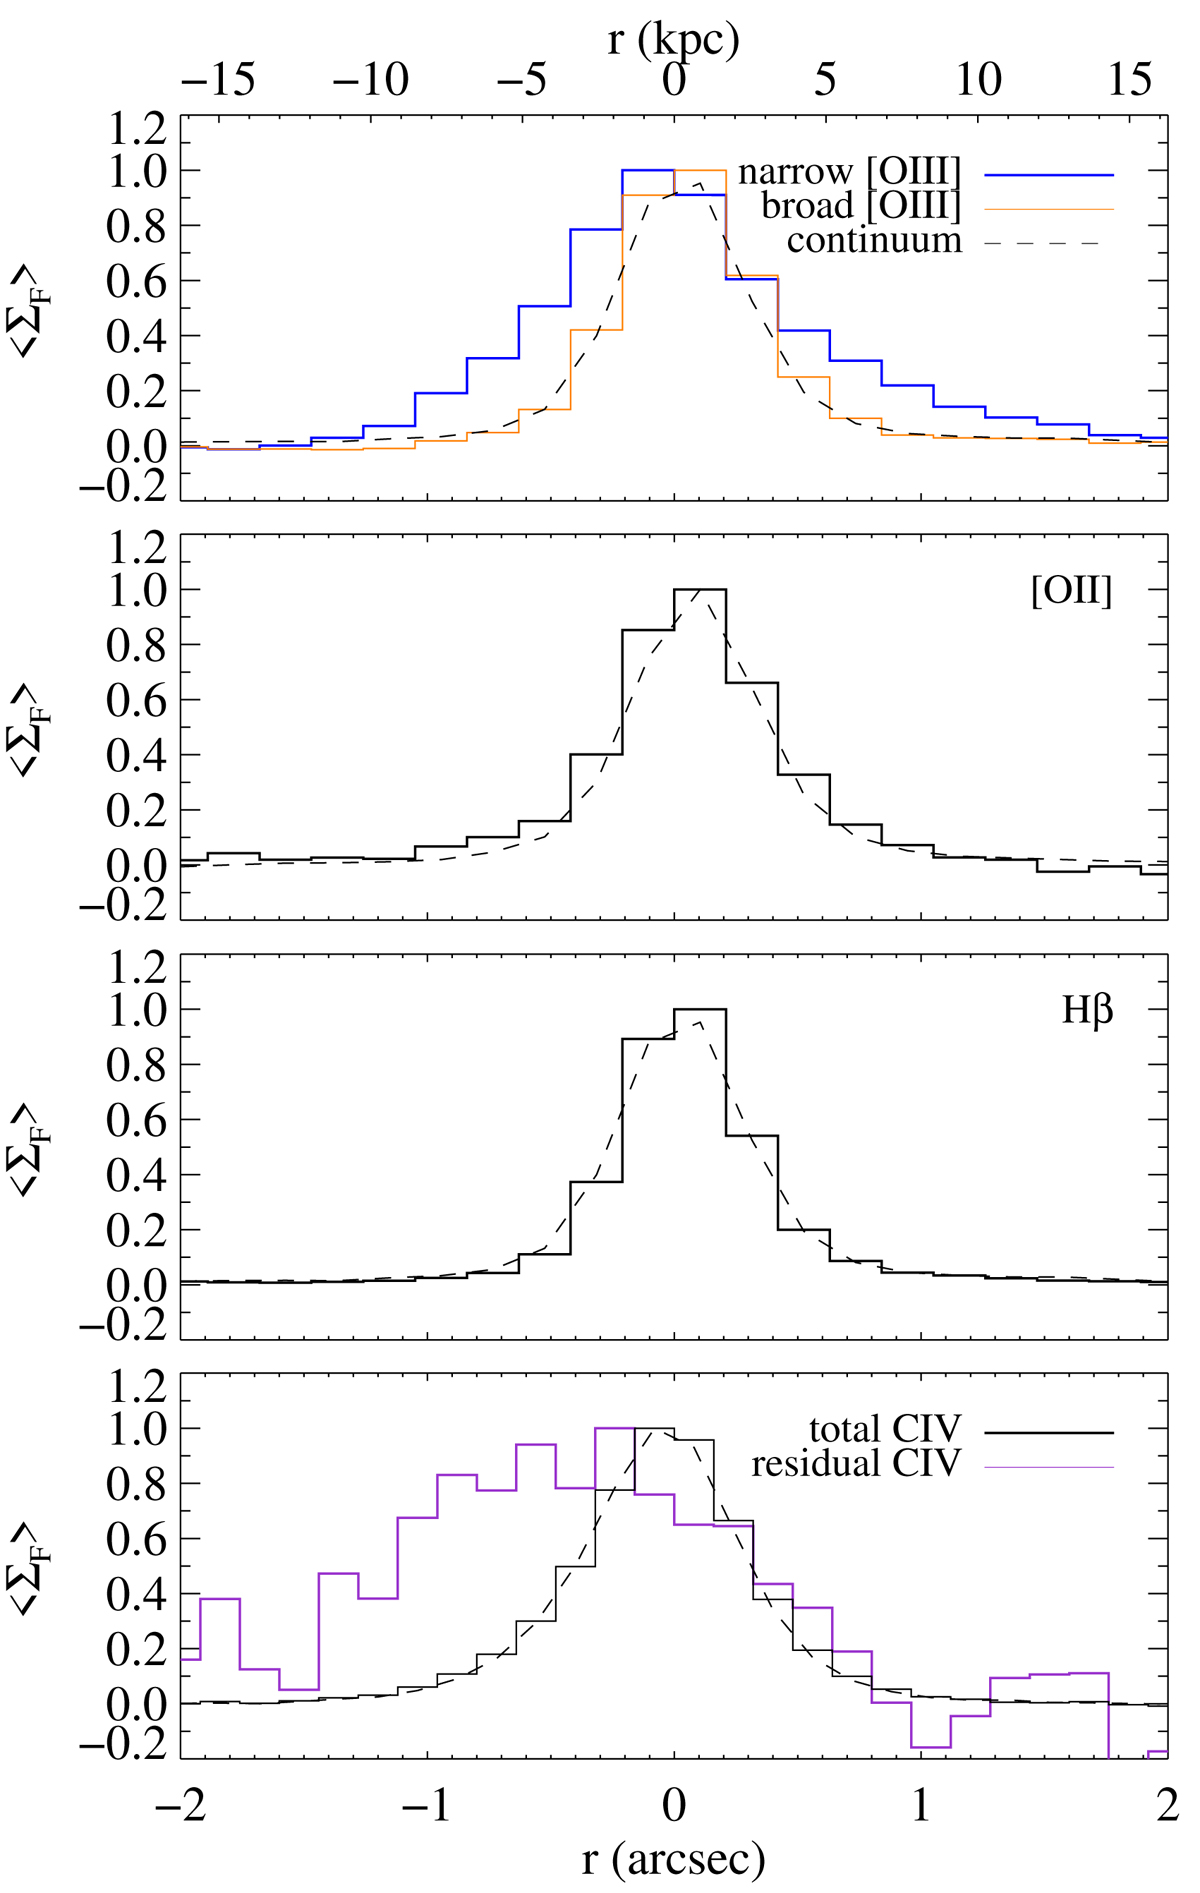
Average observed spatial profiles at the location of different emission lines. In each panel, the dashed curve shows the spatial point spread function obtained from the quasar continuum in a nearby region. We note that the profile around the narrow [O III] emission still contains a contribution from the continuum and the broad [O III] emission. For the sake of easy comparison, each profile is normalised by its maximum value.
Current usage metrics show cumulative count of Article Views (full-text article views including HTML views, PDF and ePub downloads, according to the available data) and Abstracts Views on Vision4Press platform.
Data correspond to usage on the plateform after 2015. The current usage metrics is available 48-96 hours after online publication and is updated daily on week days.
Initial download of the metrics may take a while.