Fig. 4.
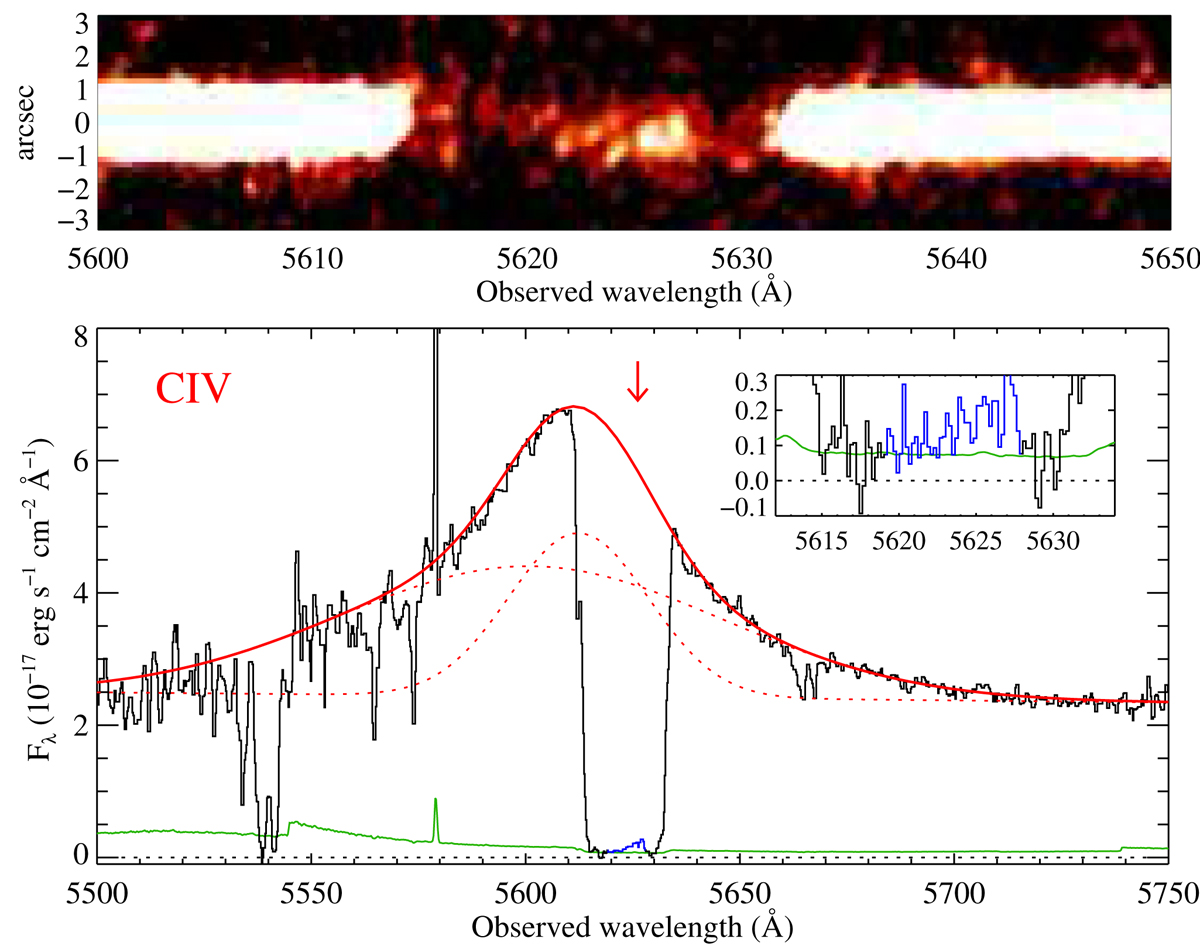
Bottom: portion of 1D X-shooter spectrum around the C IV emission line, median-smoothed using a 5-pixel sliding window for presentation purposes (black, with 1σ error level in green). The inset shows an unsmoothed zoom-in on the C IV absorption, with the blue region highlighting the residual emission. The best-fit model is shown by the red solid line and the individual Gaussians as red dotted lines. The downwards arrow indicates the systemic redshift. Top: 2D spectrum in the region featuring the C IV absorption line as well as residual C IV emission in the trough.
Current usage metrics show cumulative count of Article Views (full-text article views including HTML views, PDF and ePub downloads, according to the available data) and Abstracts Views on Vision4Press platform.
Data correspond to usage on the plateform after 2015. The current usage metrics is available 48-96 hours after online publication and is updated daily on week days.
Initial download of the metrics may take a while.