Fig. 3.
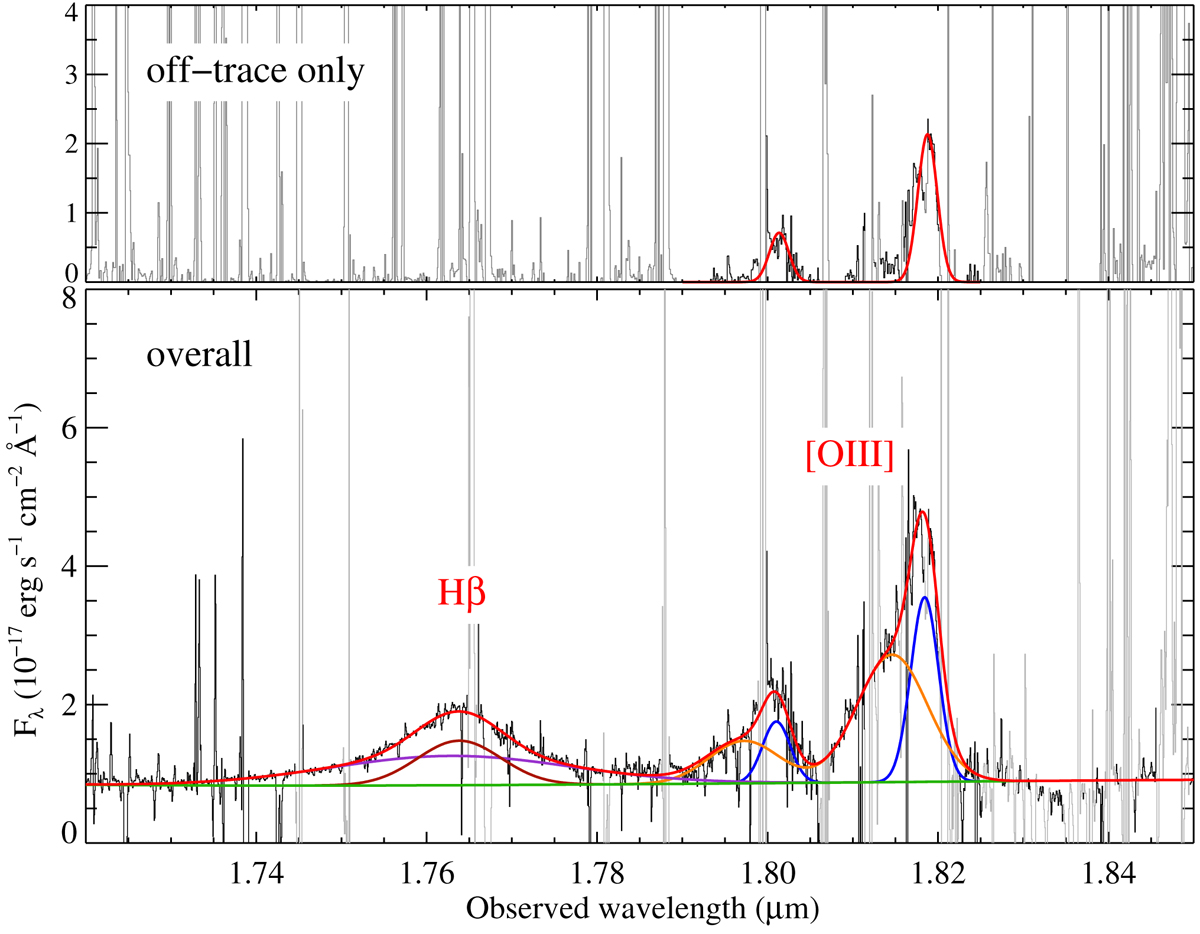
Portion of combined 1D NIR spectrum around Hβ and [O III] emission lines. Top panel: contribution from the off-trace spatially extended emission, which is apparent in both [O III] lines. Bottom panel: spectrum collapsed over its full spatial extent at wavelengths 1.790 < λ(μm) < 1.825 and the optimal extraction elsewhere, for presentation purposes. The green line shows our estimate of featureless continuum emission. Individual Gaussians constrained during the fit are shown in different colours, with the total fitted profile shown in red.
Current usage metrics show cumulative count of Article Views (full-text article views including HTML views, PDF and ePub downloads, according to the available data) and Abstracts Views on Vision4Press platform.
Data correspond to usage on the plateform after 2015. The current usage metrics is available 48-96 hours after online publication and is updated daily on week days.
Initial download of the metrics may take a while.