Fig. 22.
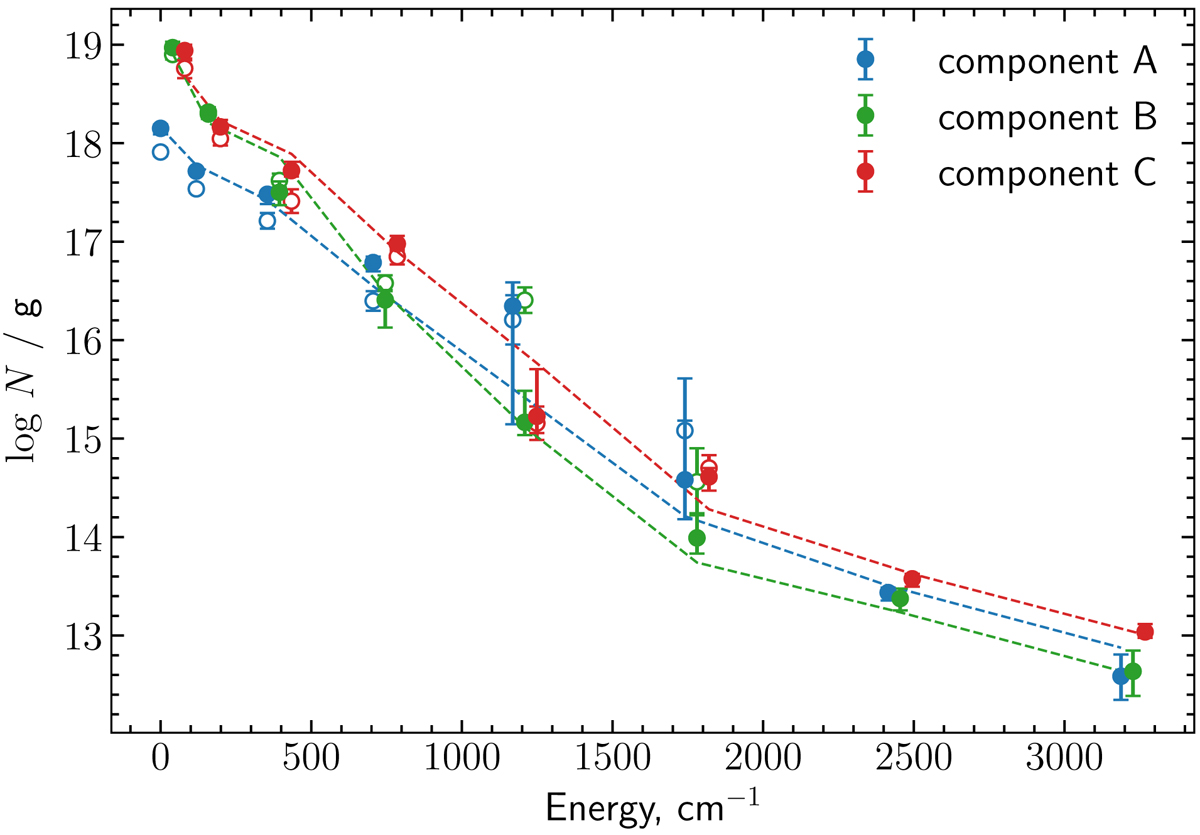
Comparison of model and observed excitation diagram of H2 rotational levels. The filled and open circles represent the measurements using vpfit and a MCMC method (see Sect. 4.2), respectively. The dashed lines show the best fit of the excitation diagram (corresponding parameters d and P marked by stars in Fig. 21). The data points are artificially shifted on the x-axis to ease representation.
Current usage metrics show cumulative count of Article Views (full-text article views including HTML views, PDF and ePub downloads, according to the available data) and Abstracts Views on Vision4Press platform.
Data correspond to usage on the plateform after 2015. The current usage metrics is available 48-96 hours after online publication and is updated daily on week days.
Initial download of the metrics may take a while.