Fig. 21.
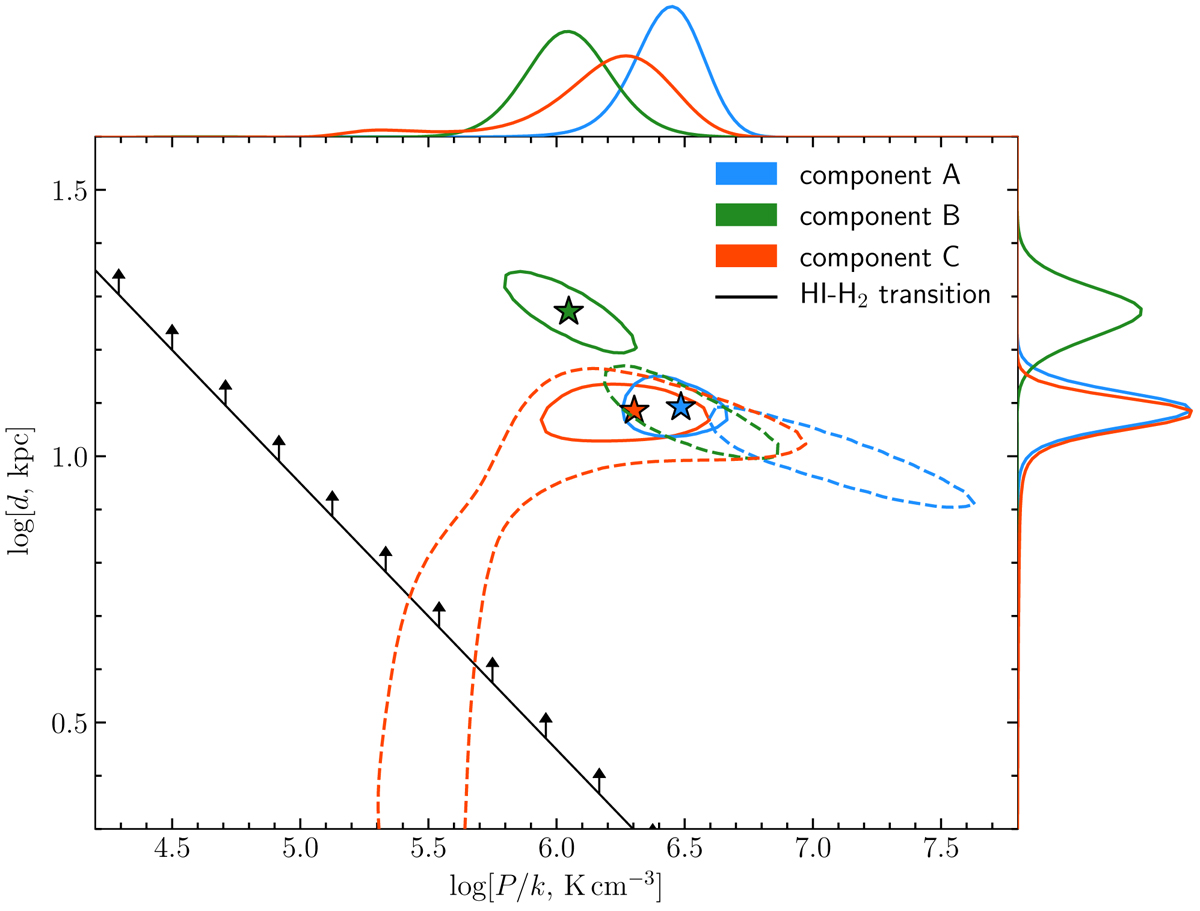
Constraints on thermal pressure, P, and distance from cloud to AGN, d, obtained by modelling the excitation of H2 rotational levels with the PDR MEUDON code. The contours show formal regions that contain 0.683 probability distribution functions. The solid and dashed lines correspond to the estimates based on MCMC and vpfit result of H2 fit (see Table 3), respectively. The marginalised probability distribution functions (along right and top axes) and the best-fit values (stars) are shown for MCMC results only for the sake of clarity. The black line with upwards arrows show the constraints from the H2-H I transition, assuming the kinetic temperature is T ∼ 100 K, which is consistent with the observations.
Current usage metrics show cumulative count of Article Views (full-text article views including HTML views, PDF and ePub downloads, according to the available data) and Abstracts Views on Vision4Press platform.
Data correspond to usage on the plateform after 2015. The current usage metrics is available 48-96 hours after online publication and is updated daily on week days.
Initial download of the metrics may take a while.