Fig. 12.
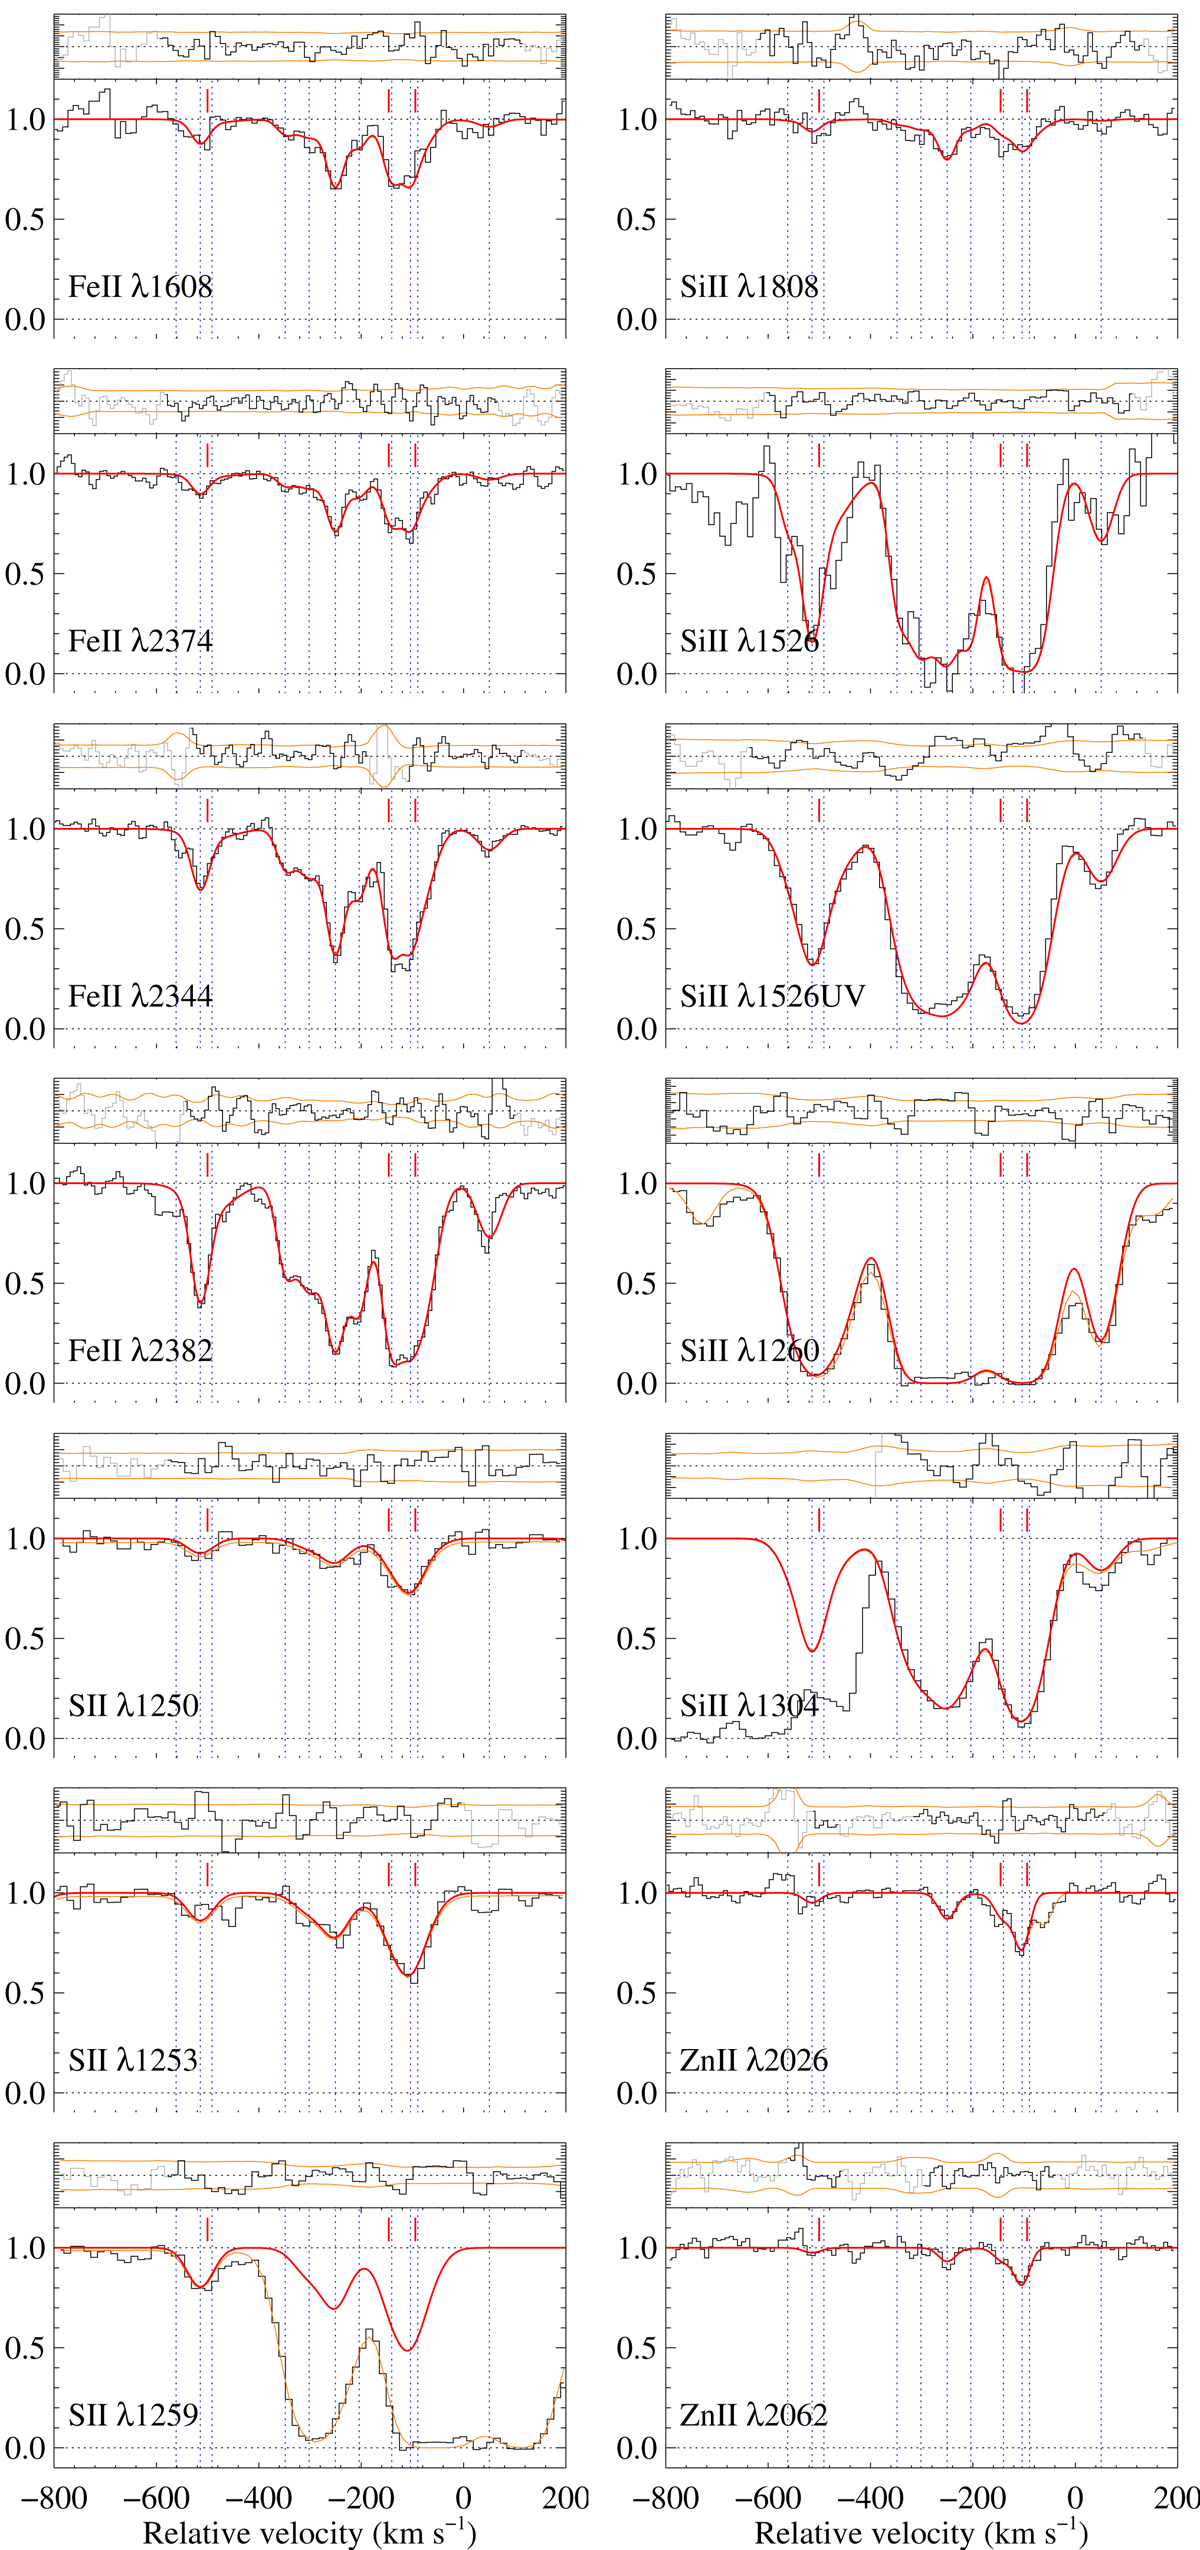
Fit to metal absorption lines. The observed data are shown in black with the synthetic profile for each given species overplotted in red. In case of several lines contributing to the observed profile (see e.g., S IIλ1259 and Si IIλ1260), the contribution for the labelled line alone is shown in red, while the total synthetic profile is shown in orange. Residuals are shown in the small panel above each line, with the orange line showing the 1σ error level. The location of the different components of the model are indicated by blue vertical dashed lines, with short red marks showing the position of H2 components. The zero of the velocity scale is set to zref = 2.631.
Current usage metrics show cumulative count of Article Views (full-text article views including HTML views, PDF and ePub downloads, according to the available data) and Abstracts Views on Vision4Press platform.
Data correspond to usage on the plateform after 2015. The current usage metrics is available 48-96 hours after online publication and is updated daily on week days.
Initial download of the metrics may take a while.