Fig. 11.
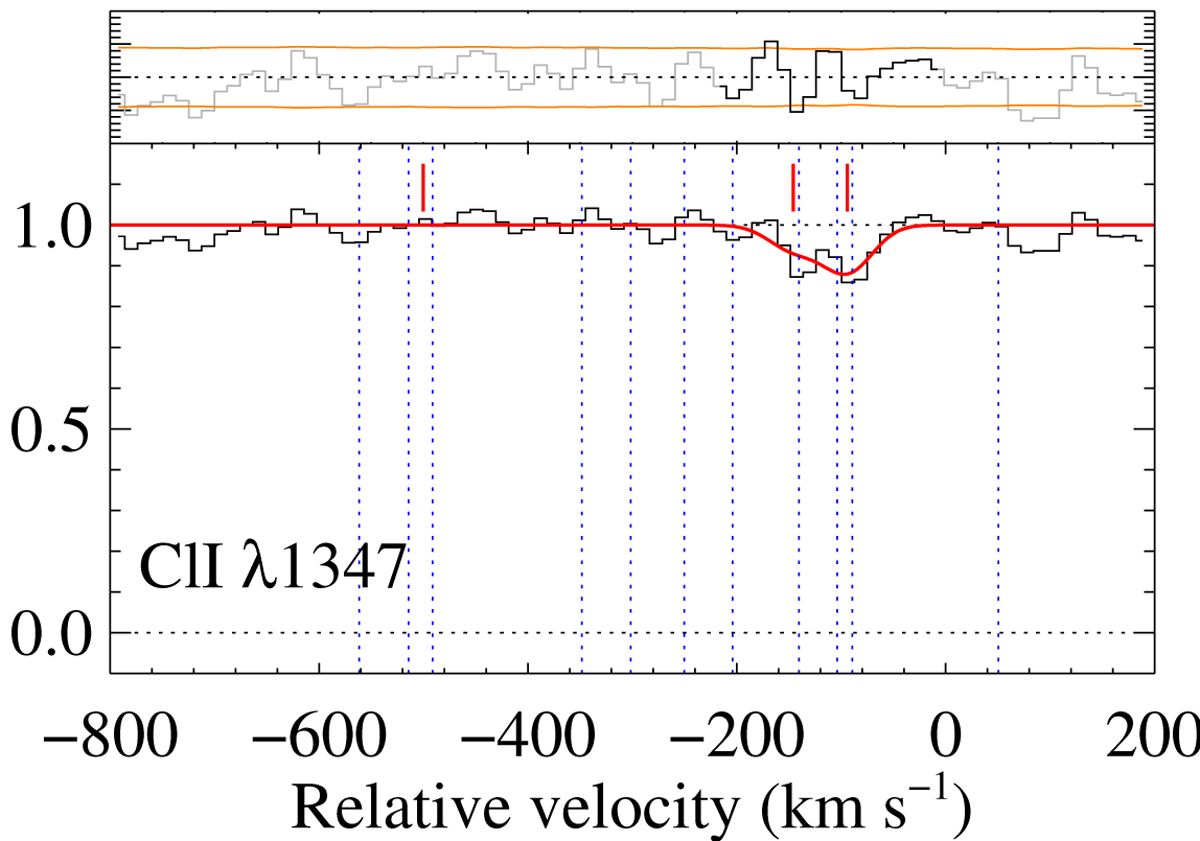
Fit to neutral chlorine absorption line. The observed data are shown in black, with the best-fit profile shown in red. Top panel: residuals (black) and 1σ error level (orange). The short tick marks show the location of the H2 components, while long dashed blue lines show those of other metal lines. As for all similar figures in this work, the origin of the velocity scale is set to zref = 2.631.
Current usage metrics show cumulative count of Article Views (full-text article views including HTML views, PDF and ePub downloads, according to the available data) and Abstracts Views on Vision4Press platform.
Data correspond to usage on the plateform after 2015. The current usage metrics is available 48-96 hours after online publication and is updated daily on week days.
Initial download of the metrics may take a while.