Fig. 10.
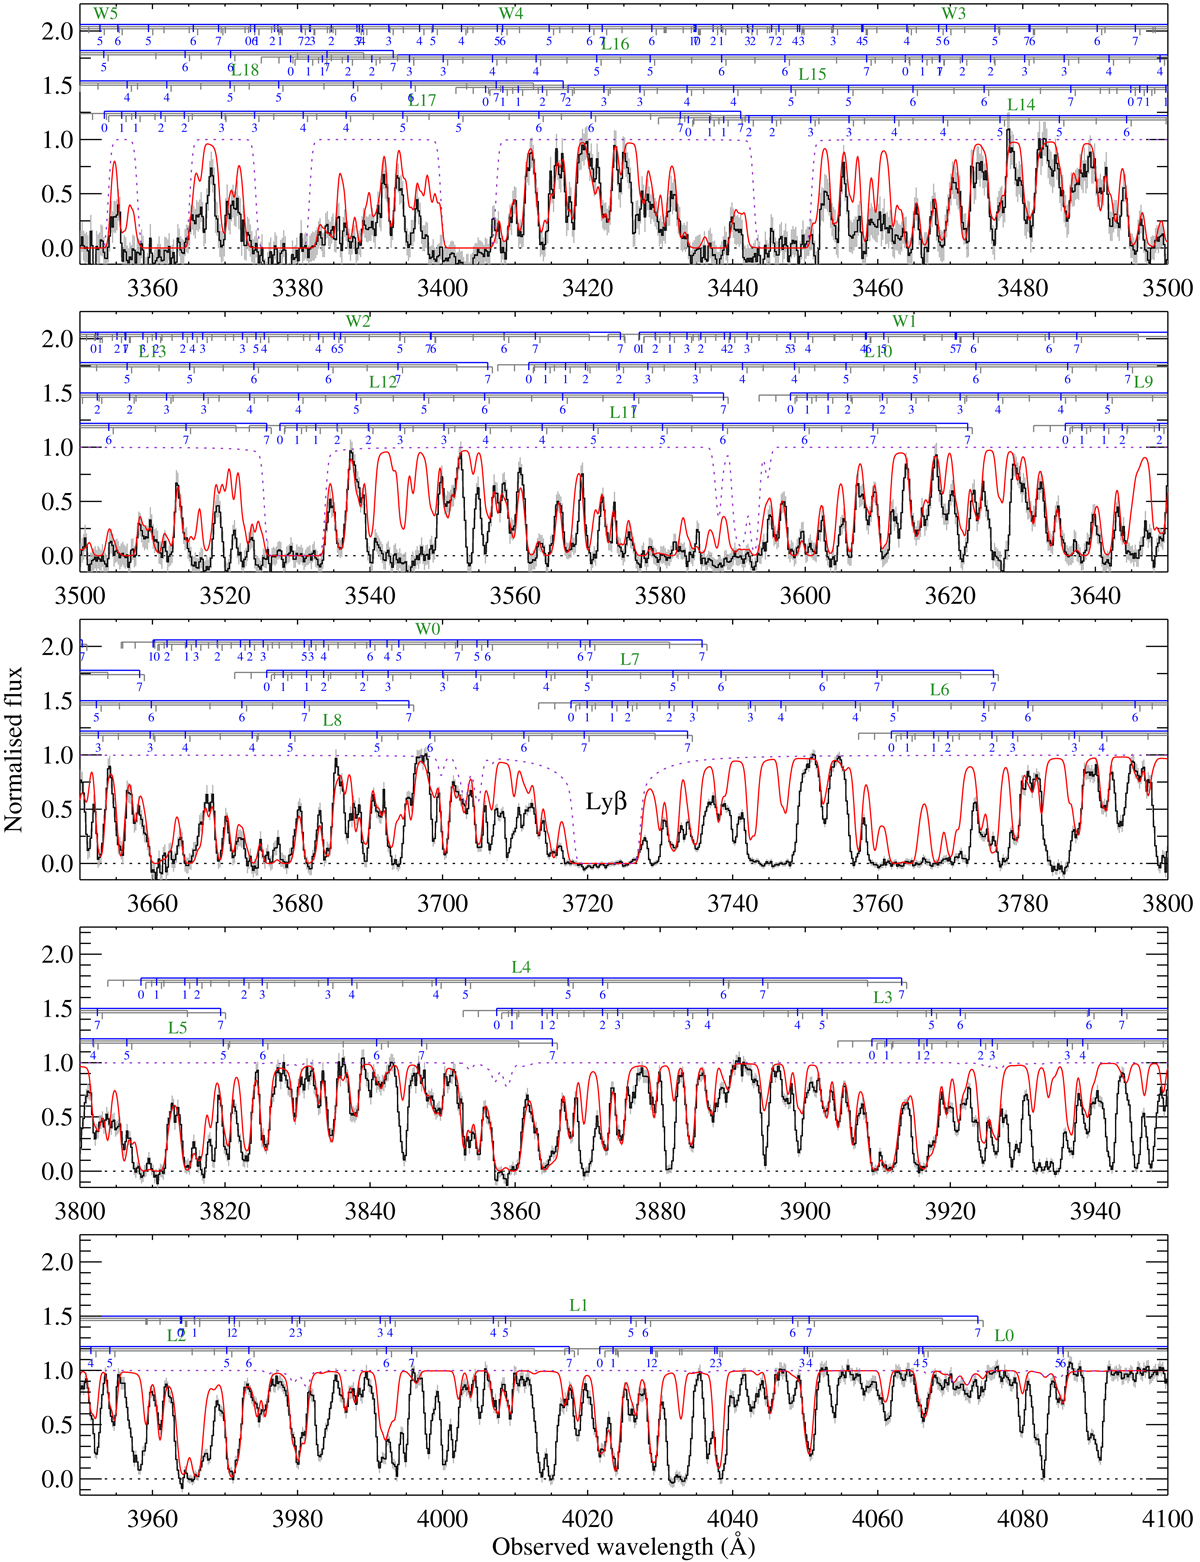
Portion of X-shooter UVB spectrum of J0015+1842 (black, with uncertainties in grey). Horizontal blue segments connect rotational levels (short tick marks) from a given Lyman (L) or Werner (W) band of H2 for the central H2 component. The same is shown in grey for the two other components, but they are not labelled for visibility. The overall model (MCMC-based) spectrum is over-plotted in red, with contribution from non-H2 lines (H I and metal lines) shown as a dotted purple line.
Current usage metrics show cumulative count of Article Views (full-text article views including HTML views, PDF and ePub downloads, according to the available data) and Abstracts Views on Vision4Press platform.
Data correspond to usage on the plateform after 2015. The current usage metrics is available 48-96 hours after online publication and is updated daily on week days.
Initial download of the metrics may take a while.