Fig. A.2.
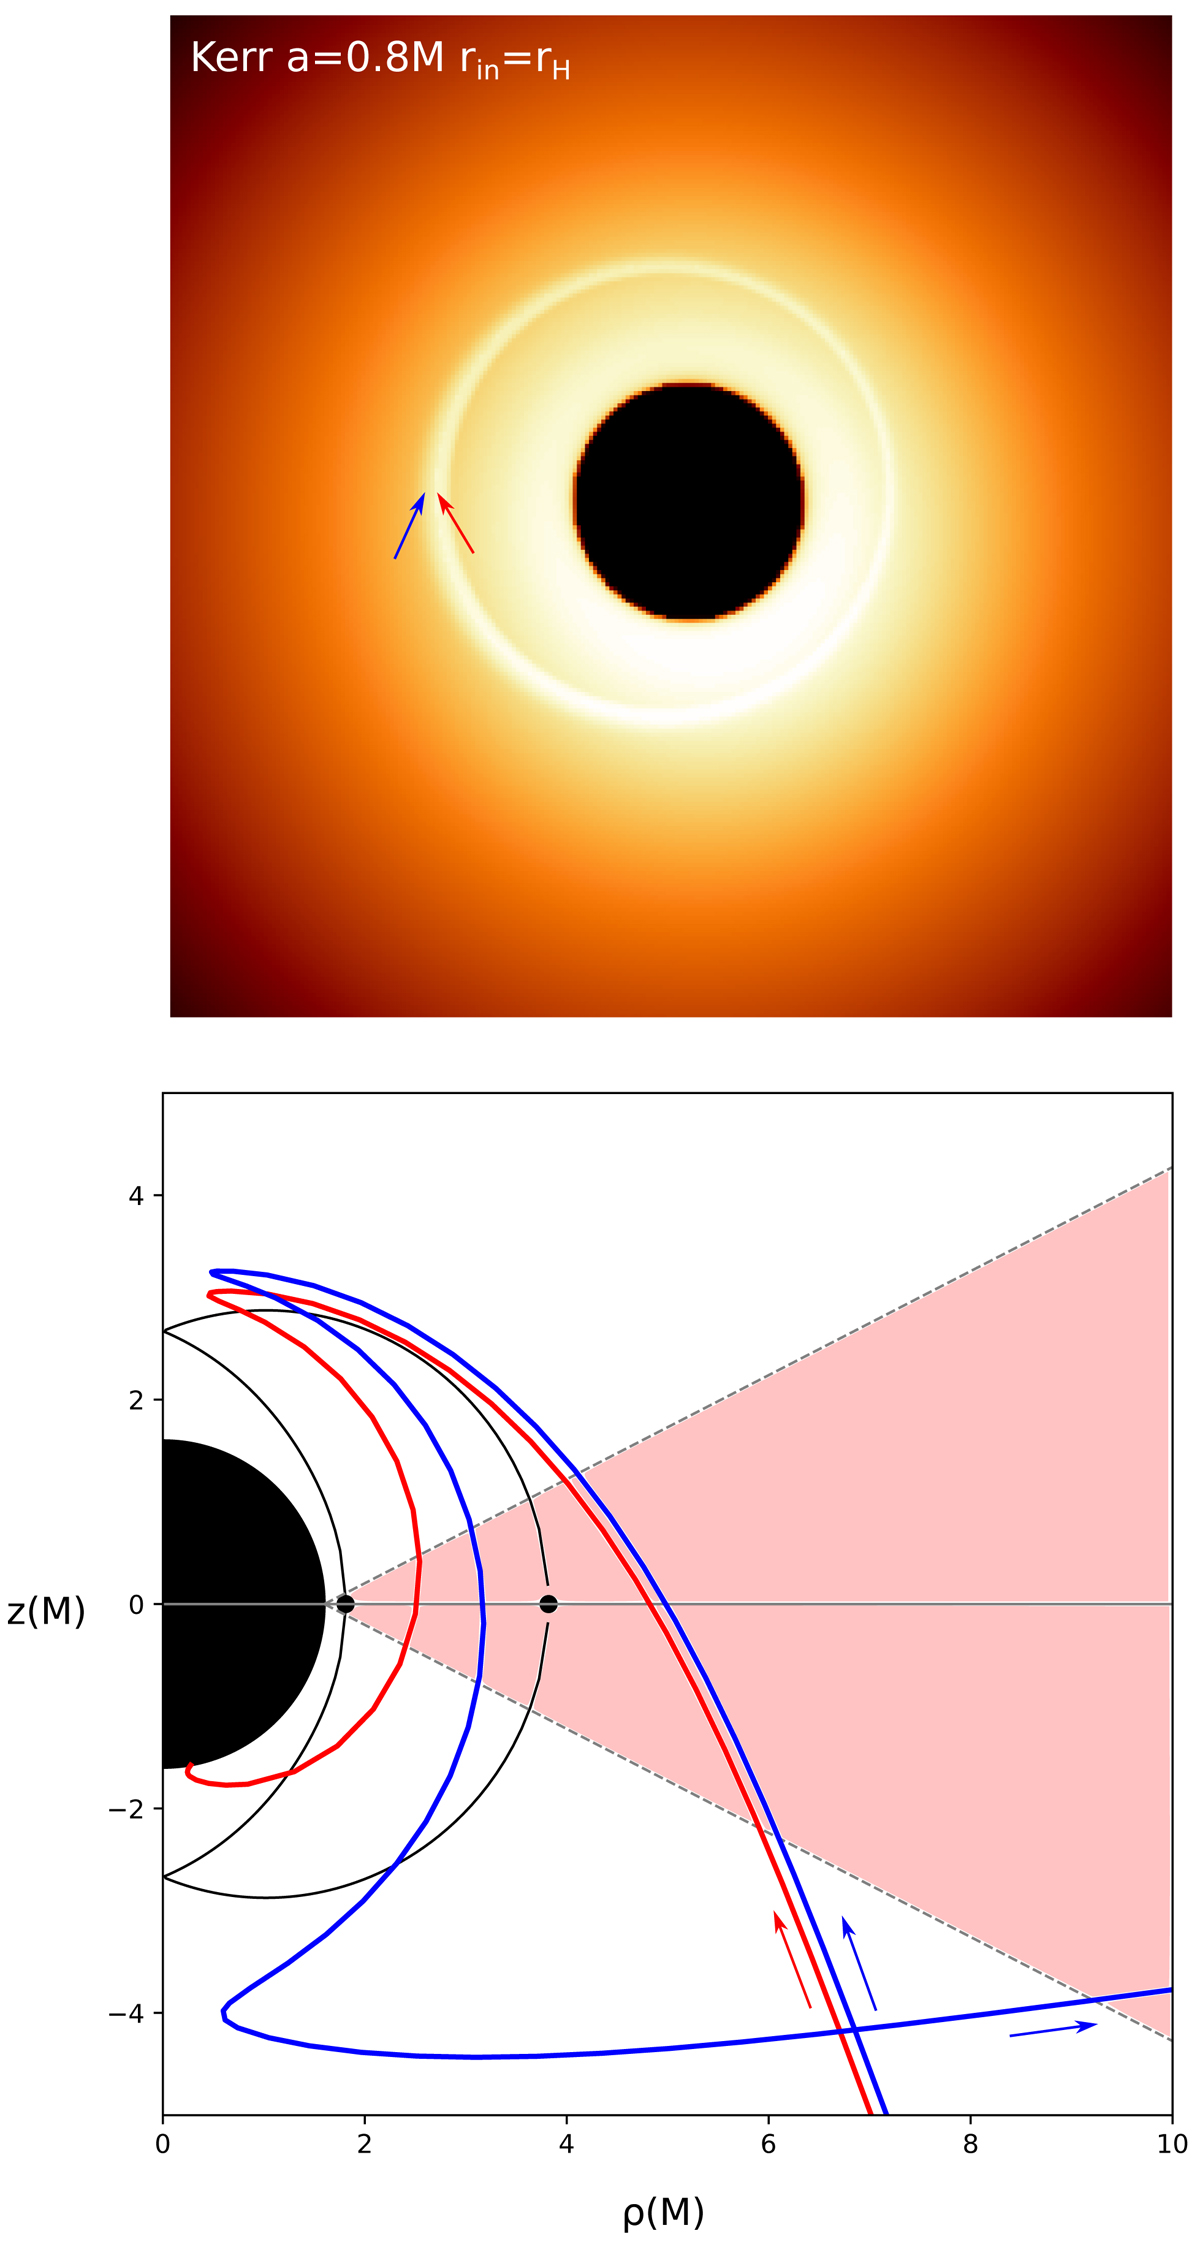
Similar figure to Fig. 4 to which we refer for the details of the bottom panel. The top panel is shown in logarithmic scale. The red and blue geodesics of the bottom panel correspond to the pixels labeled by the red and blue arrows in the top panel. the red geodesic is within the secondary ring while the blue geodesic lies just outside. The red geodesic asymptotically approaches the event horizon when ray traced back in time.
Current usage metrics show cumulative count of Article Views (full-text article views including HTML views, PDF and ePub downloads, according to the available data) and Abstracts Views on Vision4Press platform.
Data correspond to usage on the plateform after 2015. The current usage metrics is available 48-96 hours after online publication and is updated daily on week days.
Initial download of the metrics may take a while.