Fig. 14.
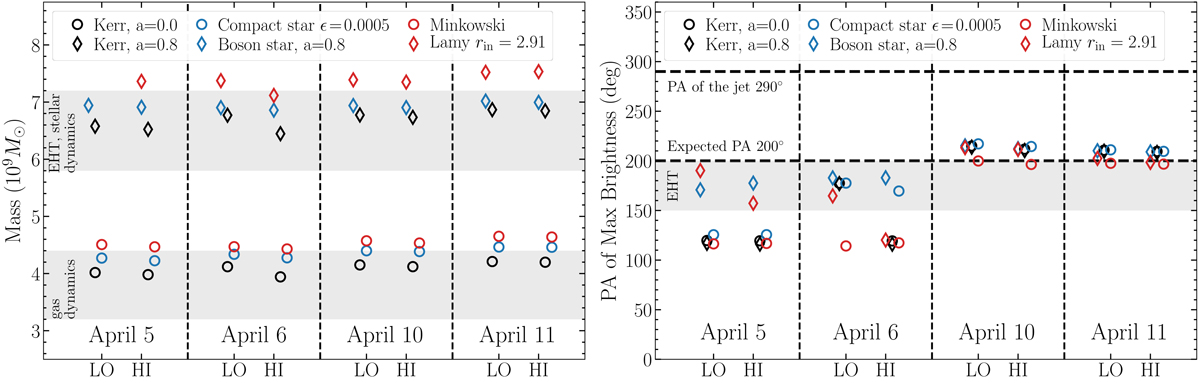
Results of fitting the models of Sect. 3 to the EHT data sets. Gray bands denote previous measurements of mass and orientation of the M87*. Left: masses of the best-fit models. Different models with spin a = 0.8 give mass measurement consistent with that reported by the EHT. Models with zero spin give systematically inconsistent mass estimate. Right: position angles (east of north) of the brightest region in the best-fit models. All models constrain the brightness maximum to be located in the south of the source image, consistent with the EHT results.
Current usage metrics show cumulative count of Article Views (full-text article views including HTML views, PDF and ePub downloads, according to the available data) and Abstracts Views on Vision4Press platform.
Data correspond to usage on the plateform after 2015. The current usage metrics is available 48-96 hours after online publication and is updated daily on week days.
Initial download of the metrics may take a while.