Fig. A.2.
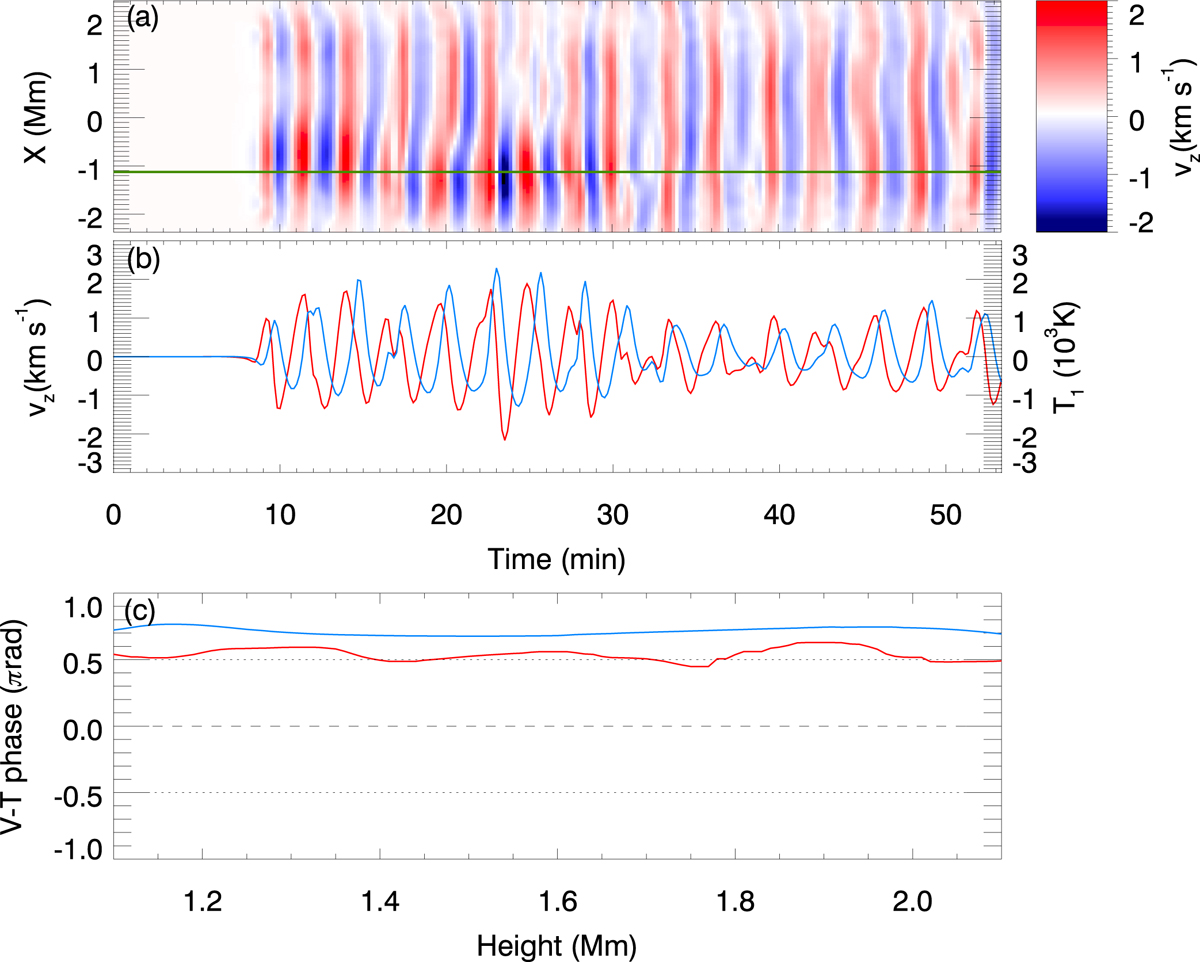
Numerical simulations of wave propagation in a sunspot umbra. Panel a: vertical velocity at z = 1.35 Mm for all the horizontal positions. Panel b: vertical velocity (red line, left axis) and temperature fluctuations (blue line, right axis) at X = −1.1 Mm (location indicated by the vertical green line in panel a). Panel c: average phase difference between velocity and temperature oscillations for waves with a frequency between 5 and 6 mHz as a function of atmospheric height. The red line represents the phase shift for standing waves from a simulation with a resonant cavity. The blue line corresponds to propagating waves from a simulation without a transition region. Dotted (dashed) lines indicate a phase shift of ±π/2 (0).
Current usage metrics show cumulative count of Article Views (full-text article views including HTML views, PDF and ePub downloads, according to the available data) and Abstracts Views on Vision4Press platform.
Data correspond to usage on the plateform after 2015. The current usage metrics is available 48-96 hours after online publication and is updated daily on week days.
Initial download of the metrics may take a while.