Fig. A.1.
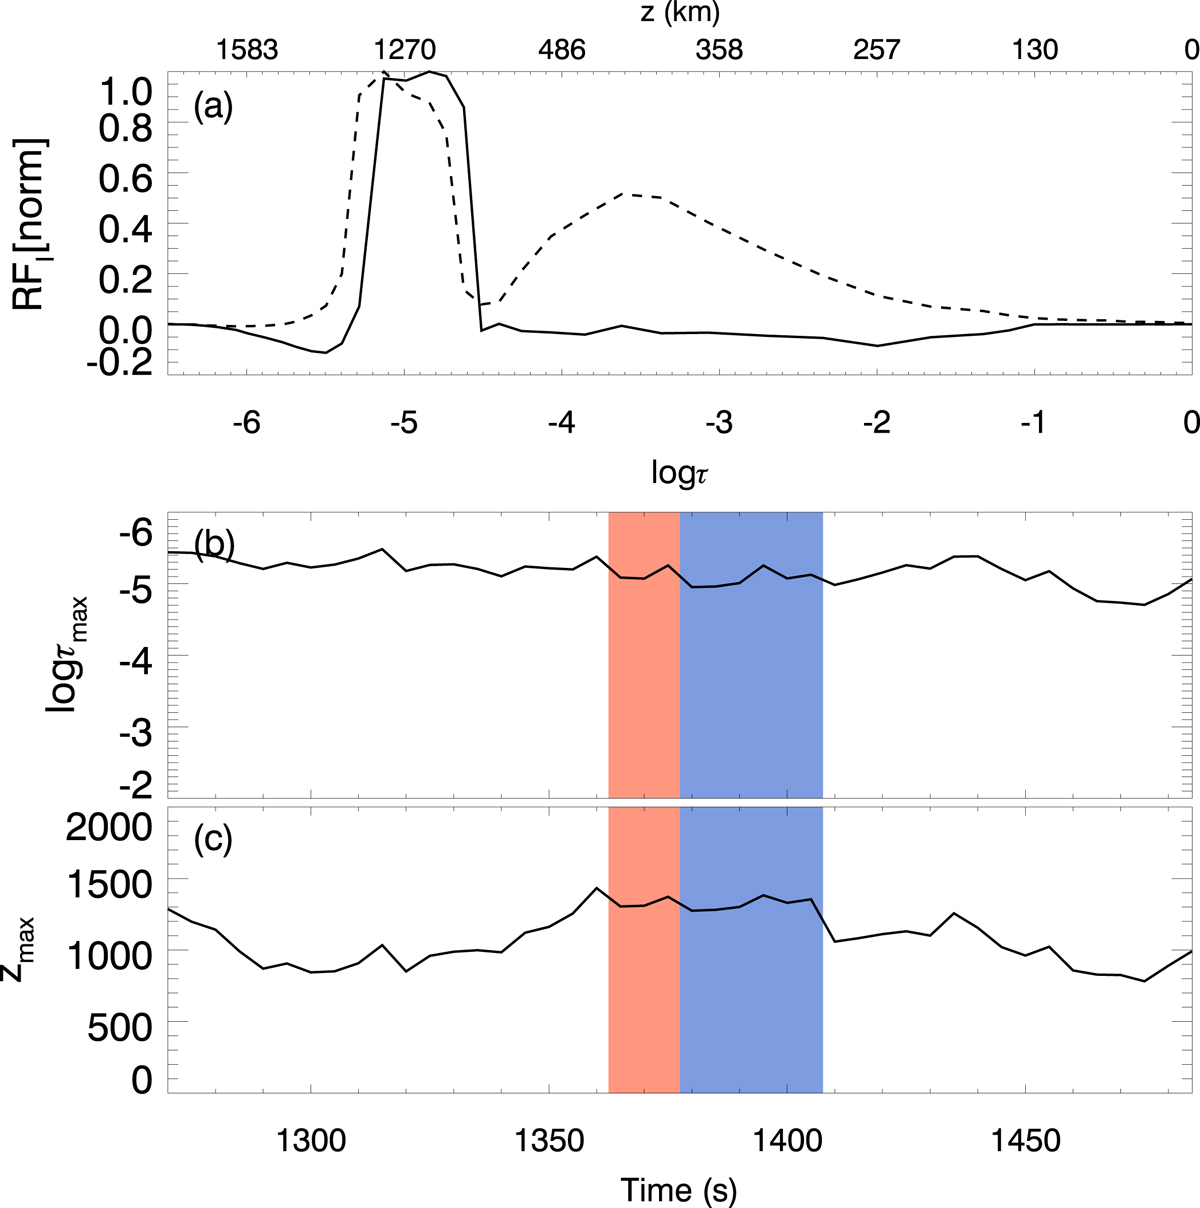
Response functions of the intensity profile of the Ca II 8542 Å line during the development of a UF. Panel a: response function of Stokes I to the temperature at the core of the line (dashed line) and to the velocity at the wavelength where the response is maximum (8542.2 Å, solid line) at t = 1405 s (see profile in Fig. 2k). The lower axis corresponds to the optical depth and the upper axis to the geometrical height. Panel b: optical depth of the maximum of the response function to temperature. Panel c: geometrical height of the maximum of the response function to temperature. The color-shaded regions in panels b and c have the same meaning as in Fig. 2.
Current usage metrics show cumulative count of Article Views (full-text article views including HTML views, PDF and ePub downloads, according to the available data) and Abstracts Views on Vision4Press platform.
Data correspond to usage on the plateform after 2015. The current usage metrics is available 48-96 hours after online publication and is updated daily on week days.
Initial download of the metrics may take a while.