Fig. 3.
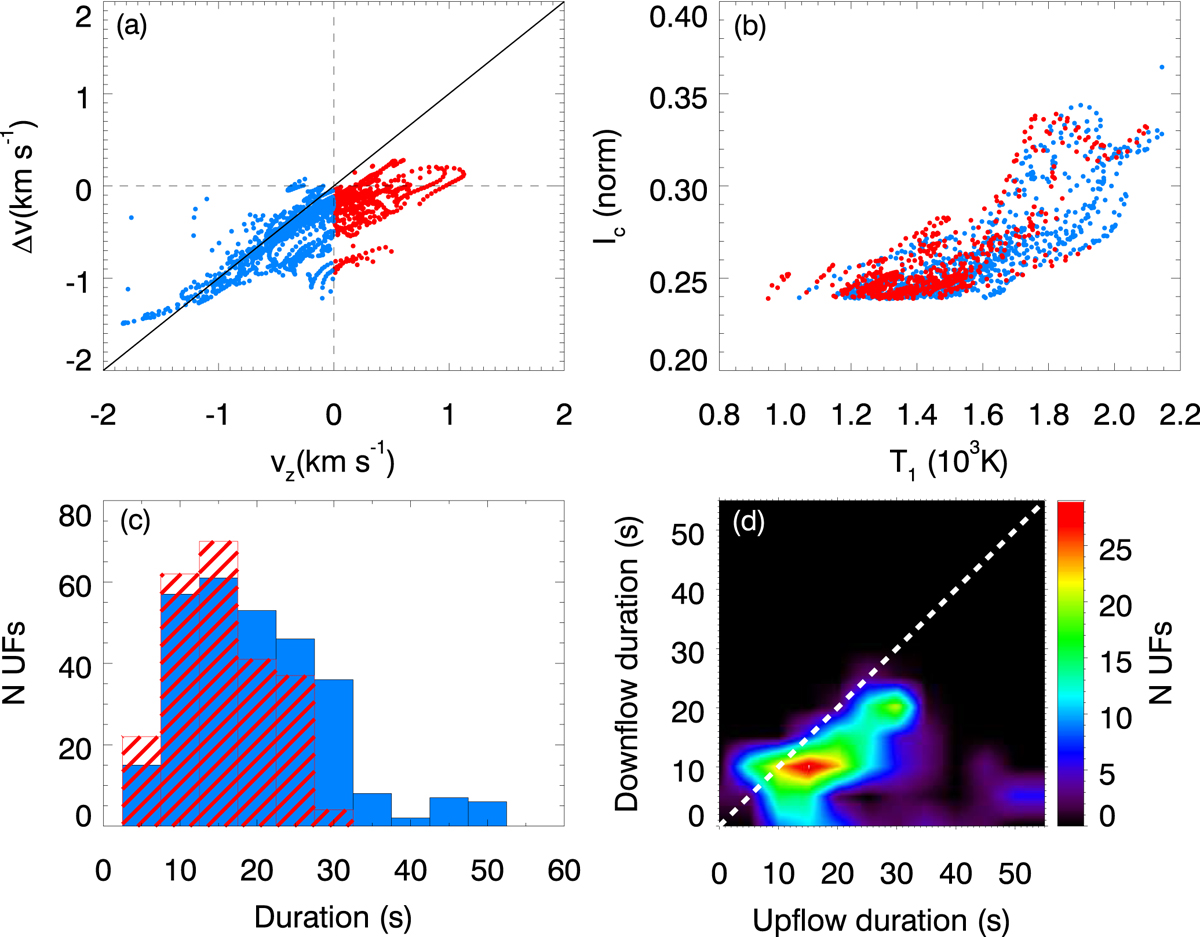
Properties of UFs in a simulation with a chromospheric resonant cavity. Panel a: wavelength shift of the center of the emission core (Δv) as a function of the vertical velocity at log τ = −5.1 (vz). Panel b: maximum intensity of the emission feature as a function of the temperature fluctuation at log τ = −5.1. Panels a and b: blue dots represent upflowing UFs and red dots correspond to downflowing UFs. Panel c: histogram illustrating the duration of upflowing (blue bars) and downflowing (bars filled with red lines) UF events. Panel d: relation between the duration of the upflowing UFs and the preceding downflowing UFs. The color bar indicates the number of occurrences of UFs with the corresponding durations.
Current usage metrics show cumulative count of Article Views (full-text article views including HTML views, PDF and ePub downloads, according to the available data) and Abstracts Views on Vision4Press platform.
Data correspond to usage on the plateform after 2015. The current usage metrics is available 48-96 hours after online publication and is updated daily on week days.
Initial download of the metrics may take a while.