Free Access
Fig. 2.
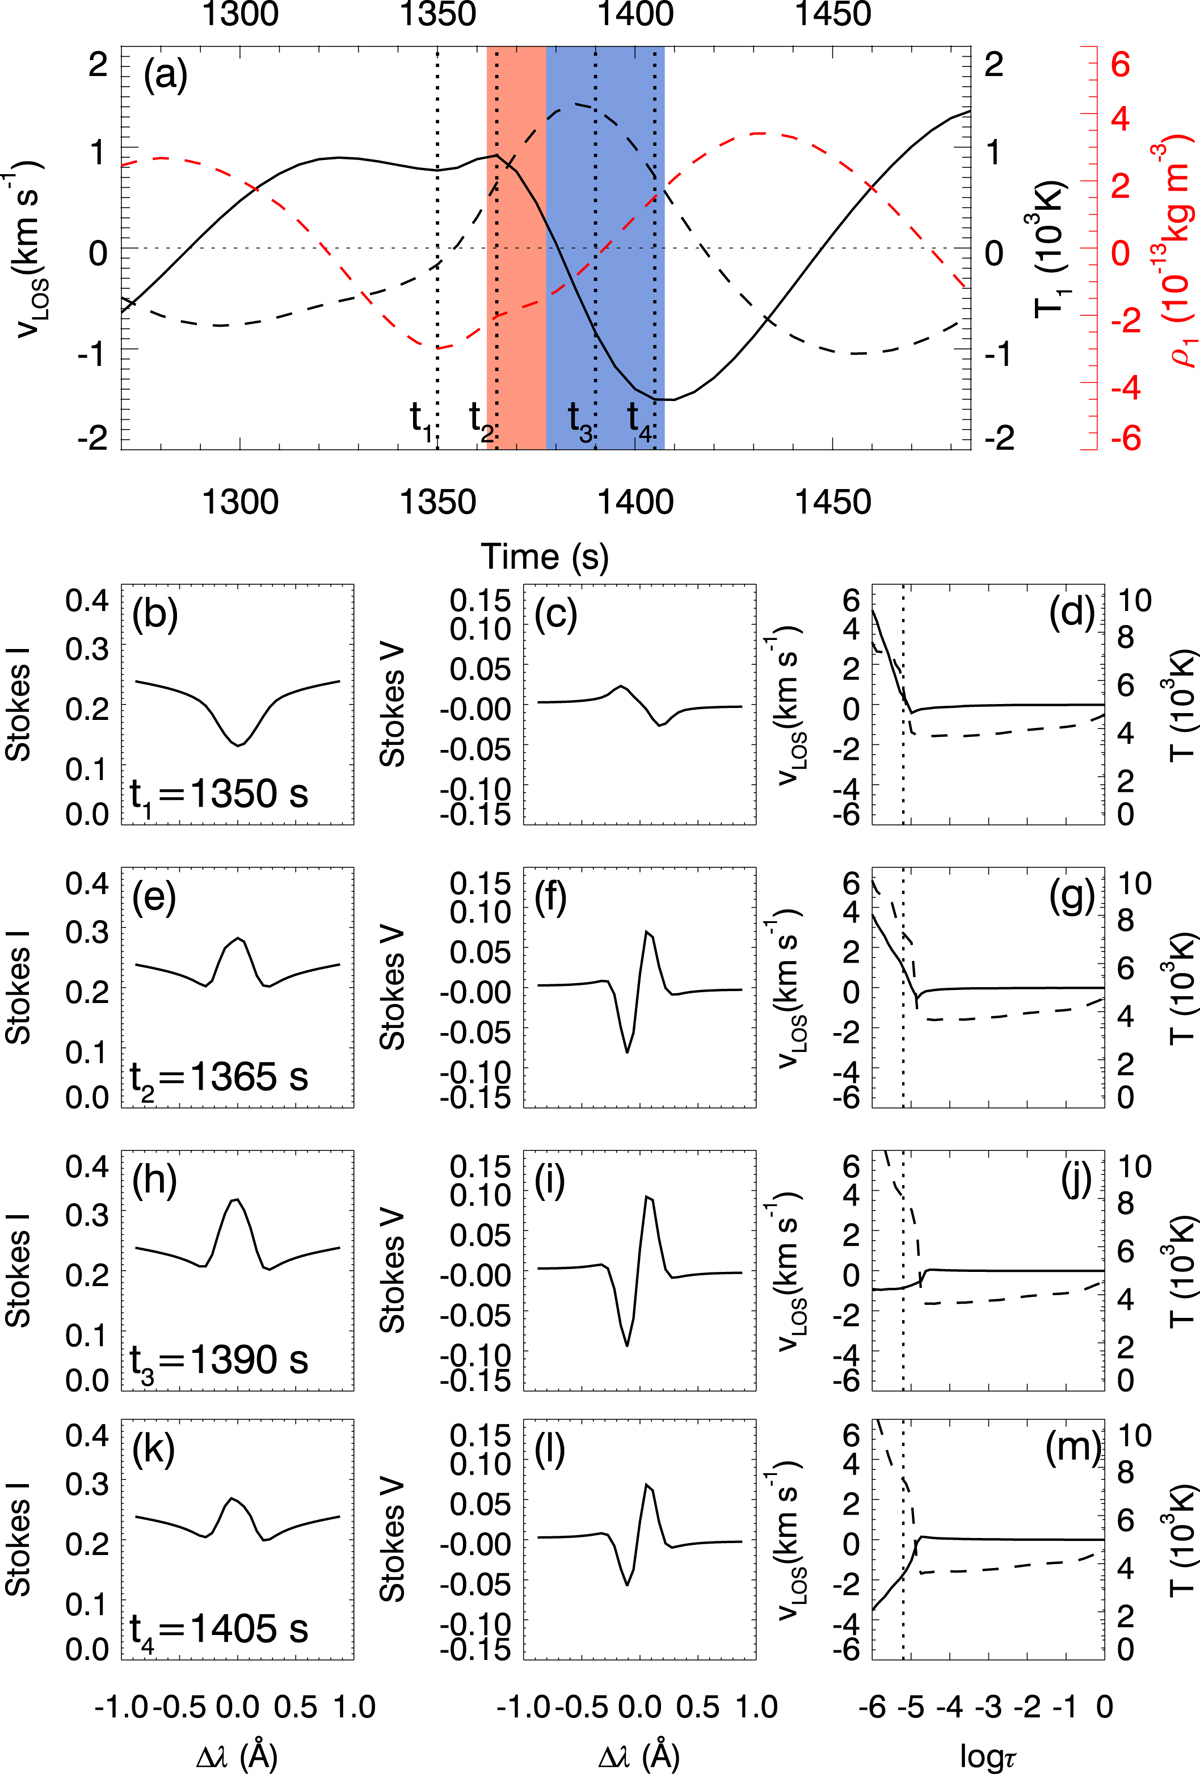
Same as Fig. 1, but for standing oscillations. The red shaded region in panel a indicates the time when a UF is identified in the Stokes profiles and the atmosphere is downflowing at log τ = −5.1.
Current usage metrics show cumulative count of Article Views (full-text article views including HTML views, PDF and ePub downloads, according to the available data) and Abstracts Views on Vision4Press platform.
Data correspond to usage on the plateform after 2015. The current usage metrics is available 48-96 hours after online publication and is updated daily on week days.
Initial download of the metrics may take a while.