Fig. 1.
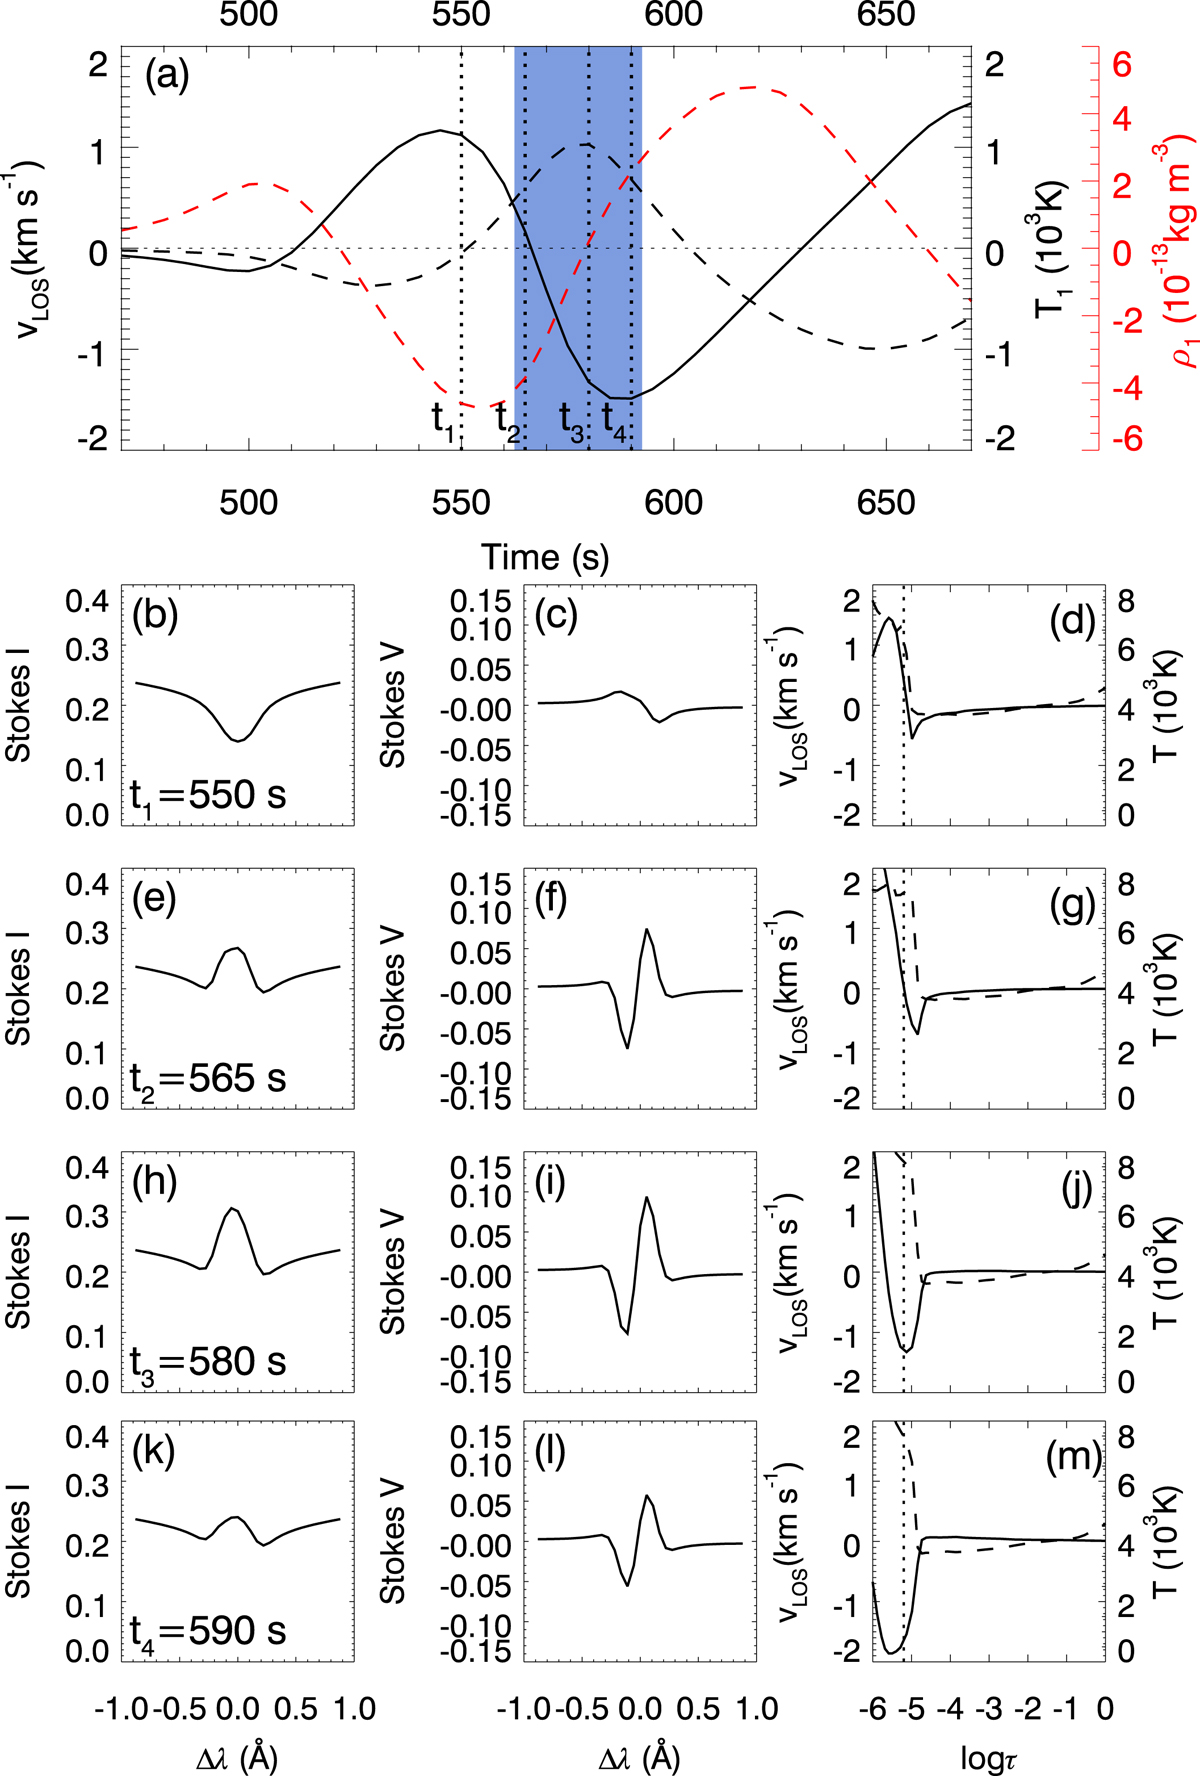
Development of a UF produced by propagating waves as seen in Ca II 8542 Å. Panel a: temporal evolution of the vertical velocity (solid line, left axis), temperature (dashed black line, black right axis), and density (dashed red line, red right axis) fluctuations at z = 1.35 Mm. The blue shaded region corresponds to the time when a UF is identified in the Stokes profiles and the atmosphere is upflowing at log τ = −5.1. Lower panels: stokes I (left column), Stokes V (middle column), and atmospheric models (right column). Each row corresponds to a different time step, as indicated at the bottom of the first column panels and the vertical dotted lines in panel a. In the right column, the vertical velocity (solid line, left axis) and temperature (dashed line, right axis) of the atmospheric model is plotted. The vertical dashed line marks the height of log τ = −5.1.
Current usage metrics show cumulative count of Article Views (full-text article views including HTML views, PDF and ePub downloads, according to the available data) and Abstracts Views on Vision4Press platform.
Data correspond to usage on the plateform after 2015. The current usage metrics is available 48-96 hours after online publication and is updated daily on week days.
Initial download of the metrics may take a while.