Fig. 9.
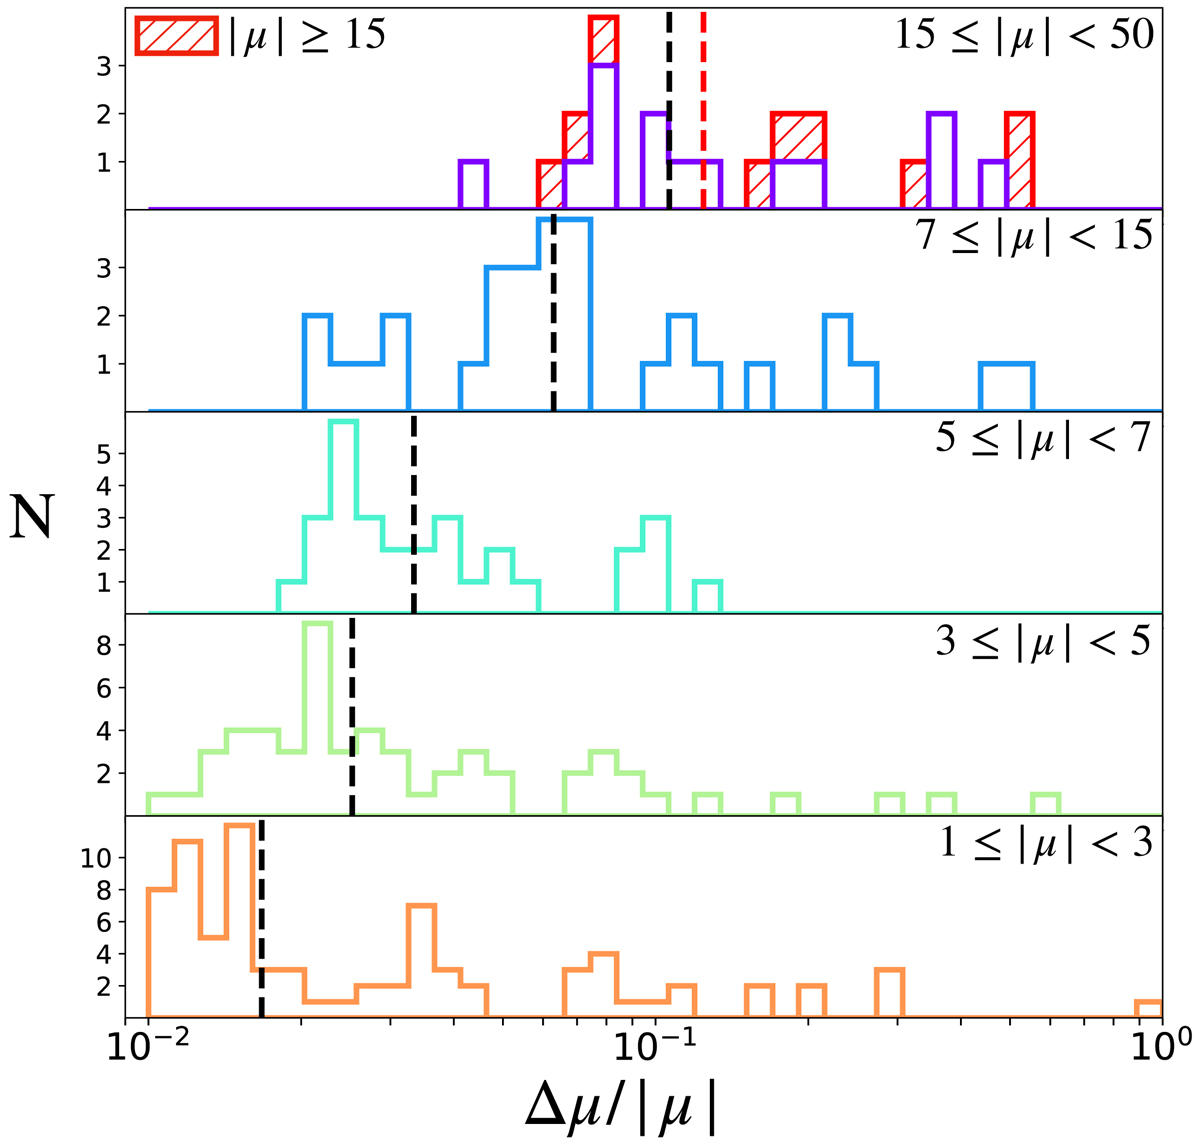
Distributions of the relative statistical error on the absolute magnification (Δμ/|μ|) for the 226 multiple images that are predicted by the reference lens model. Histograms refer to six different intervals of |μ|. Vertical black dashed lines mark the median values of each distribution (the red dash line corresponds to bin with |μ| ≥ 15).
Current usage metrics show cumulative count of Article Views (full-text article views including HTML views, PDF and ePub downloads, according to the available data) and Abstracts Views on Vision4Press platform.
Data correspond to usage on the plateform after 2015. The current usage metrics is available 48-96 hours after online publication and is updated daily on week days.
Initial download of the metrics may take a while.