Fig. 8.
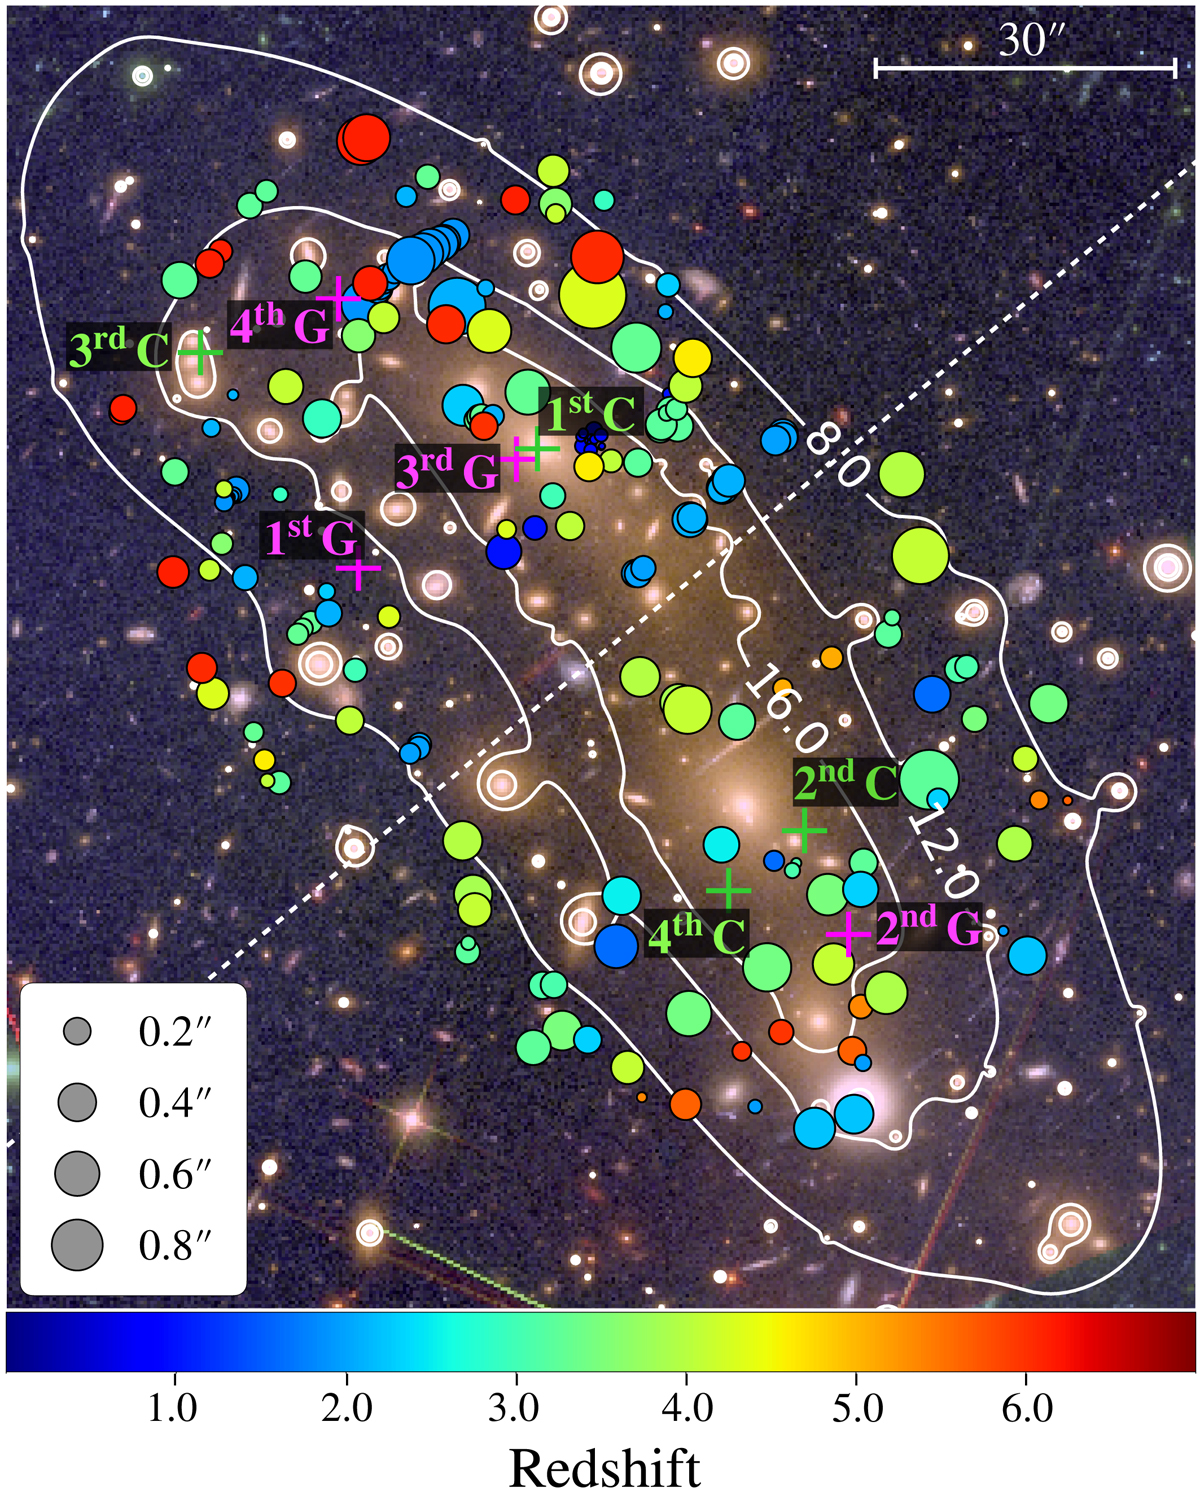
RGB image of MACS 0416 (as in Fig. 1), with overlaid contours (in white) of the total projected mass distribution obtained from the reference lens model. The contours are expressed in units of 108 M⊙ kpc−2. The magenta crosses mark the positions of the four dPIE profiles used to describe the hot-gas component of the cluster. The green crosses mark the centers of the four cluster-scale halos. The circles show the positions of the 182 observed multiple images, with colors encoding their redshift. Their sizes scale proportionally to the displacements between the observed and model-predicted positions of the multiple images (∥Δi∥). The white dashed line separates two sets of multiple images in the northern and southern fields.
Current usage metrics show cumulative count of Article Views (full-text article views including HTML views, PDF and ePub downloads, according to the available data) and Abstracts Views on Vision4Press platform.
Data correspond to usage on the plateform after 2015. The current usage metrics is available 48-96 hours after online publication and is updated daily on week days.
Initial download of the metrics may take a while.