Fig. 7.
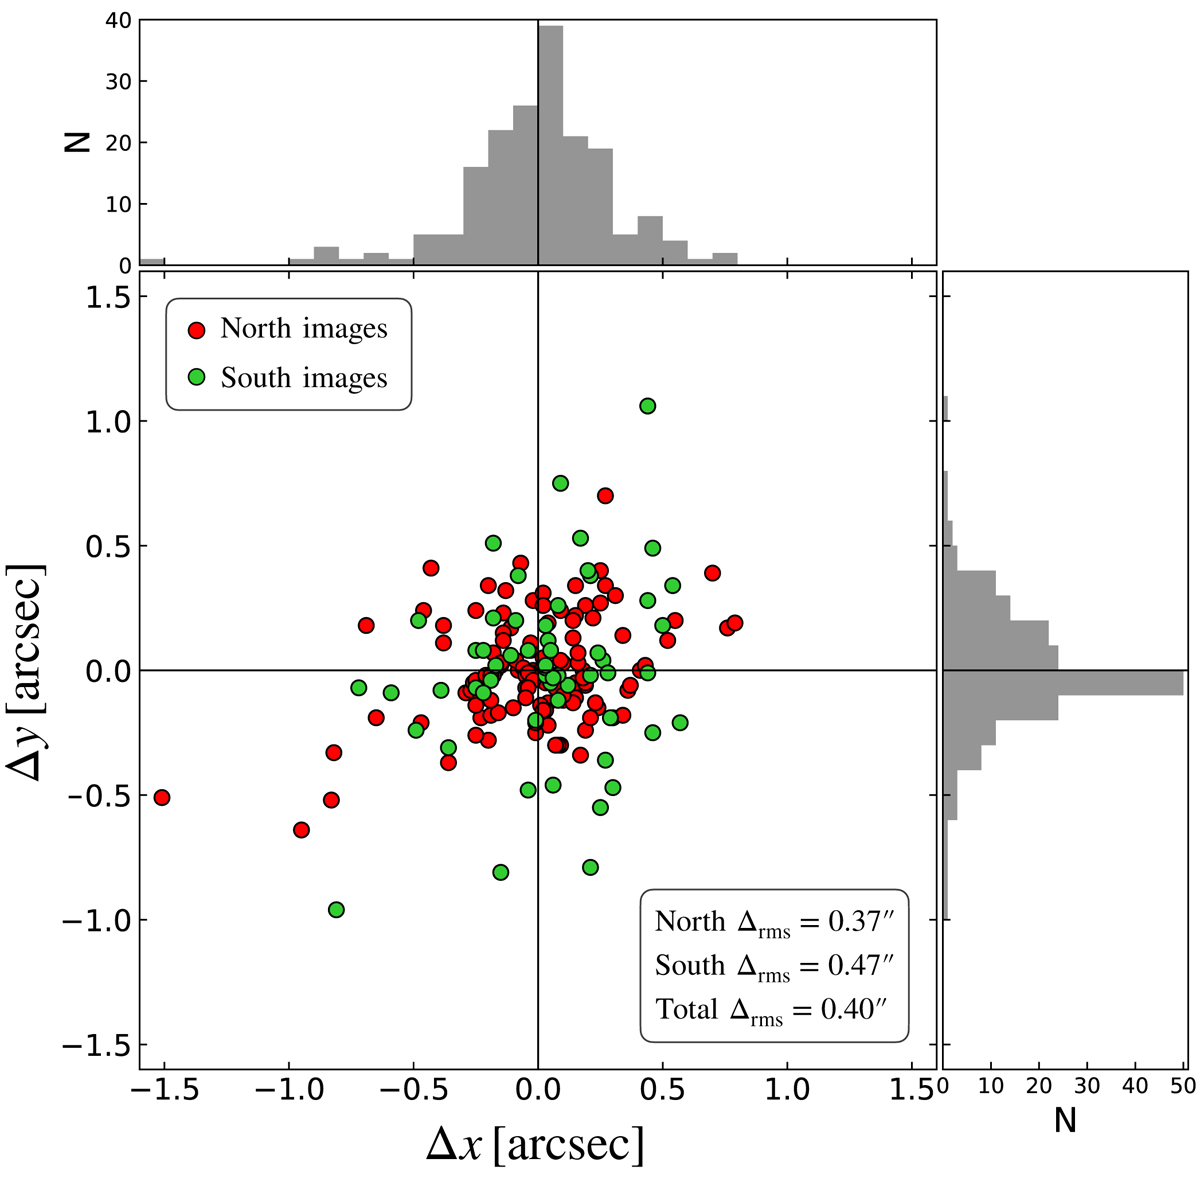
2D and 1D distributions of the displacements Δi, along x and y directions, between the observed and model-predicted positions of the 182 multiple images used to constrain the LM-4HALOS lens model, and corresponding Δrms values (see Eq. (5)). The 125 images in the north field and the 57 in the south are shown separately as red and green dots, respectively (see the dividing line between the NE and SW regions in Fig. 8).
Current usage metrics show cumulative count of Article Views (full-text article views including HTML views, PDF and ePub downloads, according to the available data) and Abstracts Views on Vision4Press platform.
Data correspond to usage on the plateform after 2015. The current usage metrics is available 48-96 hours after online publication and is updated daily on week days.
Initial download of the metrics may take a while.