Fig. 4.
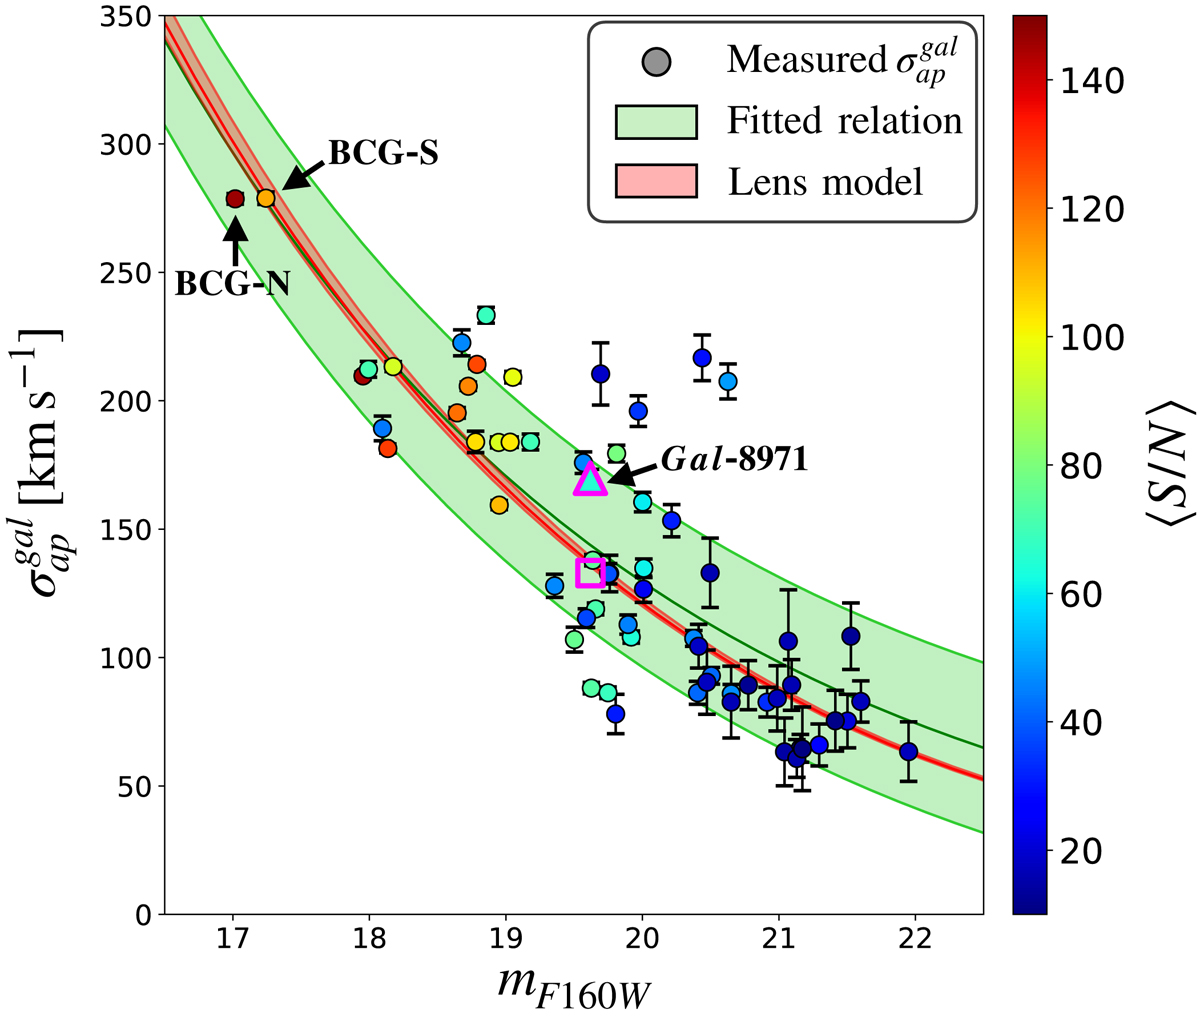
Measured internal stellar velocity dispersions of 64 cluster member galaxies as a function of their magnitudes in the HST/F160W filter (filled circles). Their colors encode the mean signal-to-noise ratio of galaxy spectra (⟨S/N⟩). The magenta triangle refers to the bright galaxy member in Sys-14 (Gal − 8971). The green solid line is the best-fit ![]() relation obtained as described in Sect. 3.3, while the light green area corresponds to measured mean scatter around the best-fit (Δσap). The red band corresponds to the 68% confidence level of the σ − mF160W relation obtained from the optimization of our reference lens model (LM-4HALOS). The magenta square indicates the velocity dispersion of Gal − 8971 and its 1-σ error, as predicted by the lens model (see Sect. 3).
relation obtained as described in Sect. 3.3, while the light green area corresponds to measured mean scatter around the best-fit (Δσap). The red band corresponds to the 68% confidence level of the σ − mF160W relation obtained from the optimization of our reference lens model (LM-4HALOS). The magenta square indicates the velocity dispersion of Gal − 8971 and its 1-σ error, as predicted by the lens model (see Sect. 3).
Current usage metrics show cumulative count of Article Views (full-text article views including HTML views, PDF and ePub downloads, according to the available data) and Abstracts Views on Vision4Press platform.
Data correspond to usage on the plateform after 2015. The current usage metrics is available 48-96 hours after online publication and is updated daily on week days.
Initial download of the metrics may take a while.