Fig. 3.
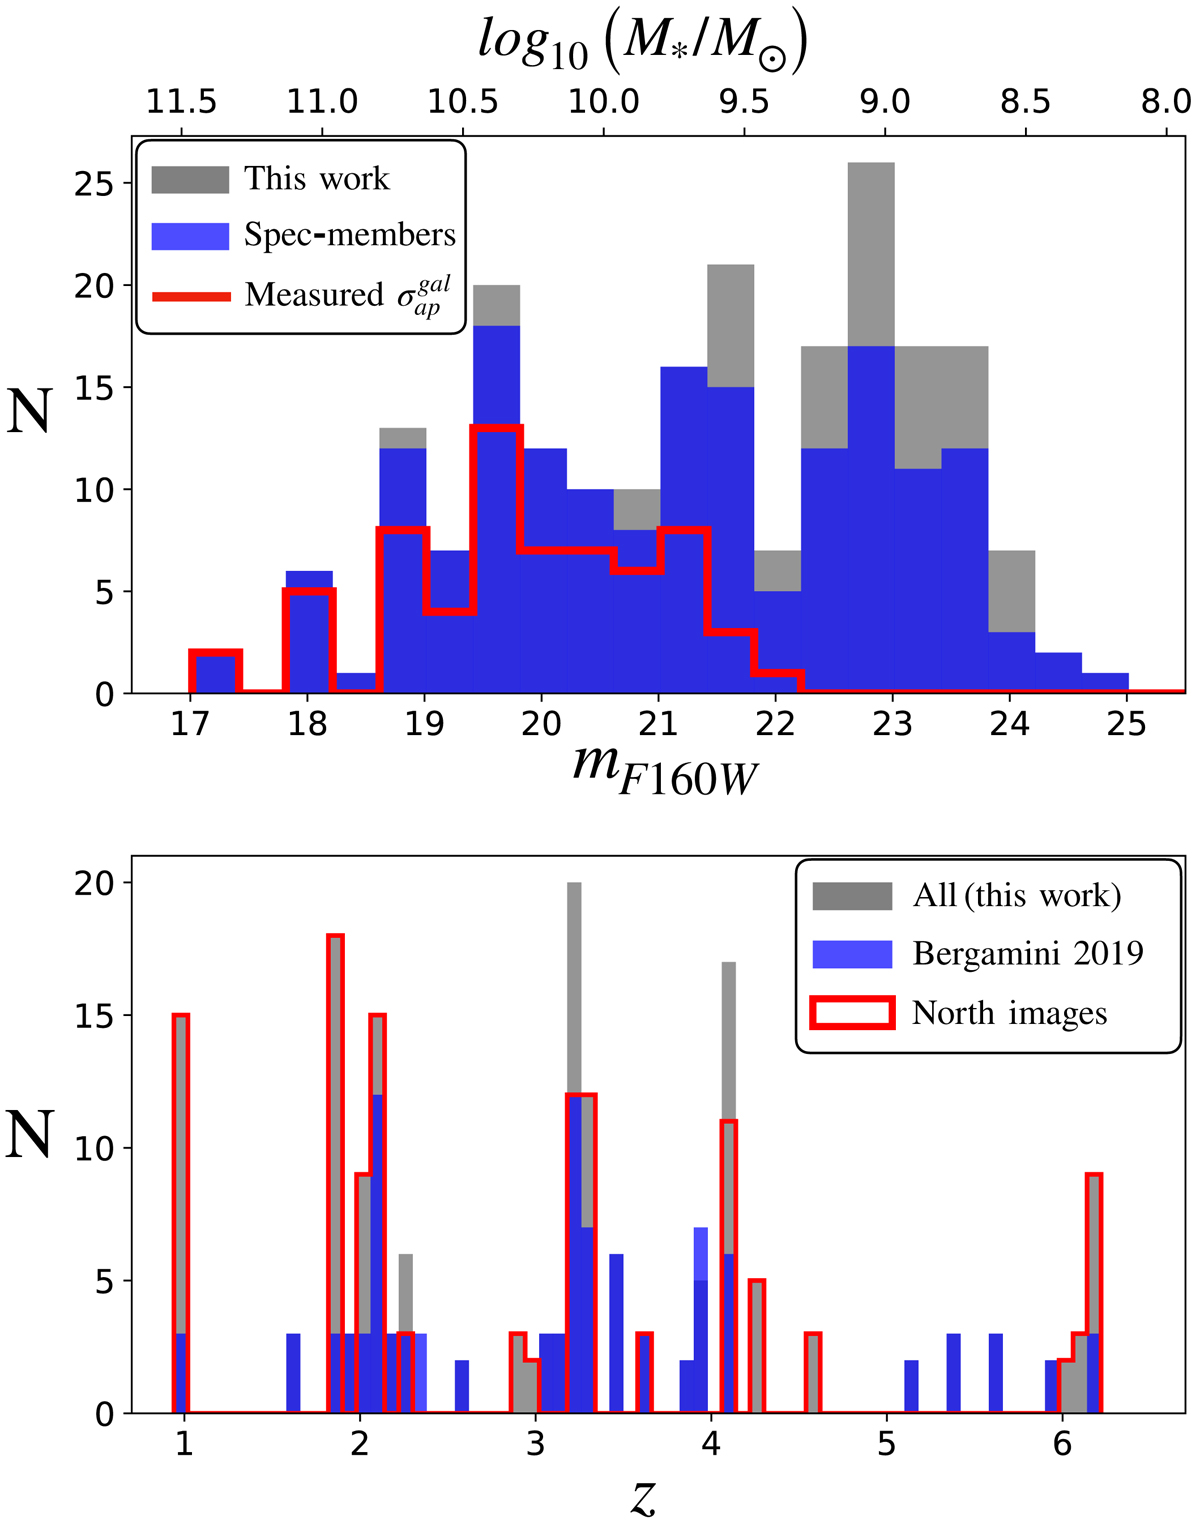
Top: distribution of cluster member galaxies as a function of their magnitudes in the HST/F160W filter. The new sample of cluster members used in our lens models is plotted in gray, with the spectroscopic members indicated in blue. Cluster members with a reliable measurement of their internal velocity dispersion are in red. The stellar mass on the top axis is based on the empirical relation in Grillo et al. (2015). Bottom: redshift distribution of the 182 multiple images used to constrain the lens models (gray). The previous sample of multiple images from C17 is shown in blue. The red histogram refers to only the multiple images from the deep NE field (above the white dashed line in Fig. 8).
Current usage metrics show cumulative count of Article Views (full-text article views including HTML views, PDF and ePub downloads, according to the available data) and Abstracts Views on Vision4Press platform.
Data correspond to usage on the plateform after 2015. The current usage metrics is available 48-96 hours after online publication and is updated daily on week days.
Initial download of the metrics may take a while.