Fig. 15.
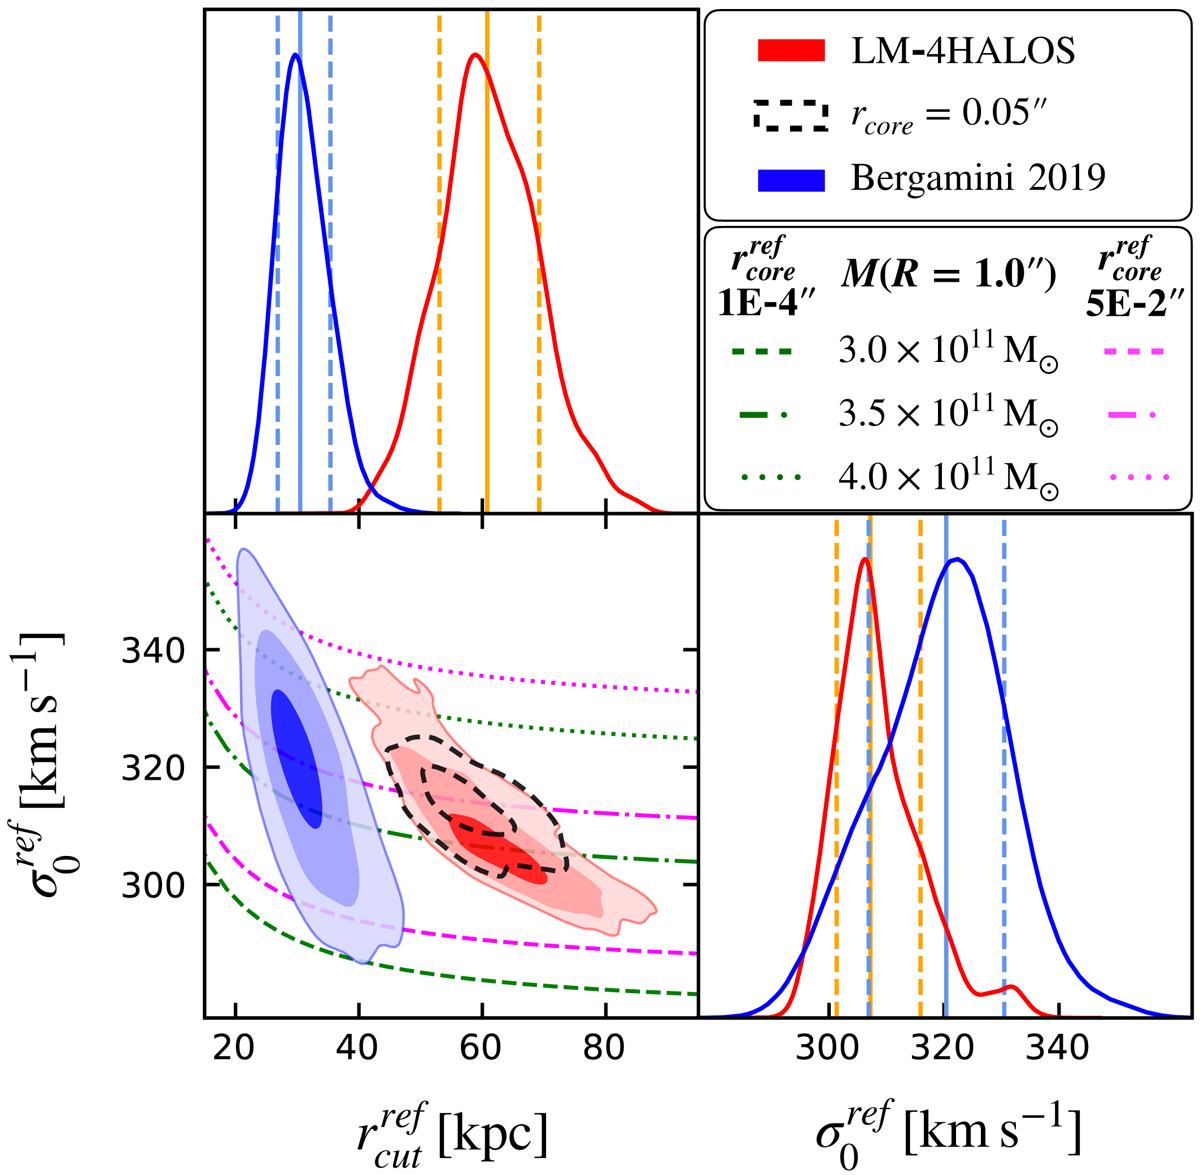
Marginalized posterior distributions of the normalizations ![]() and
and ![]() of the cluster member scaling relations (see Eqs. (8) and (9)). Normalizations are computed at the magnitude of the BCG-N (
of the cluster member scaling relations (see Eqs. (8) and (9)). Normalizations are computed at the magnitude of the BCG-N (![]() ). Red distributions refer to the LM-4HALOS reference lens model; results from the previous model by B19 model are in blue. Colored contours encompass the 1, 2, 3σ confidence levels; the vertical solid and dashed lines correspond to the 50th, 16th and 84th percentiles of the marginalized distributions. The 1 and 2σ black dashed contours refer to the LM-4HALOS model with
). Red distributions refer to the LM-4HALOS reference lens model; results from the previous model by B19 model are in blue. Colored contours encompass the 1, 2, 3σ confidence levels; the vertical solid and dashed lines correspond to the 50th, 16th and 84th percentiles of the marginalized distributions. The 1 and 2σ black dashed contours refer to the LM-4HALOS model with ![]() , instead of
, instead of ![]() of the reference model. The green and magenta lines are σ0 − rcut curves with constant projected mass, within an aperture of R = 1″ ( = 5.34 kpc at z = 0.396), for a circular dPIE profile. The mass values from bottom to top are quoted in the legend. Green curves refer to
of the reference model. The green and magenta lines are σ0 − rcut curves with constant projected mass, within an aperture of R = 1″ ( = 5.34 kpc at z = 0.396), for a circular dPIE profile. The mass values from bottom to top are quoted in the legend. Green curves refer to ![]() , magenta curves refer
, magenta curves refer ![]() (as in B19).
(as in B19).
Current usage metrics show cumulative count of Article Views (full-text article views including HTML views, PDF and ePub downloads, according to the available data) and Abstracts Views on Vision4Press platform.
Data correspond to usage on the plateform after 2015. The current usage metrics is available 48-96 hours after online publication and is updated daily on week days.
Initial download of the metrics may take a while.