Fig. 14.
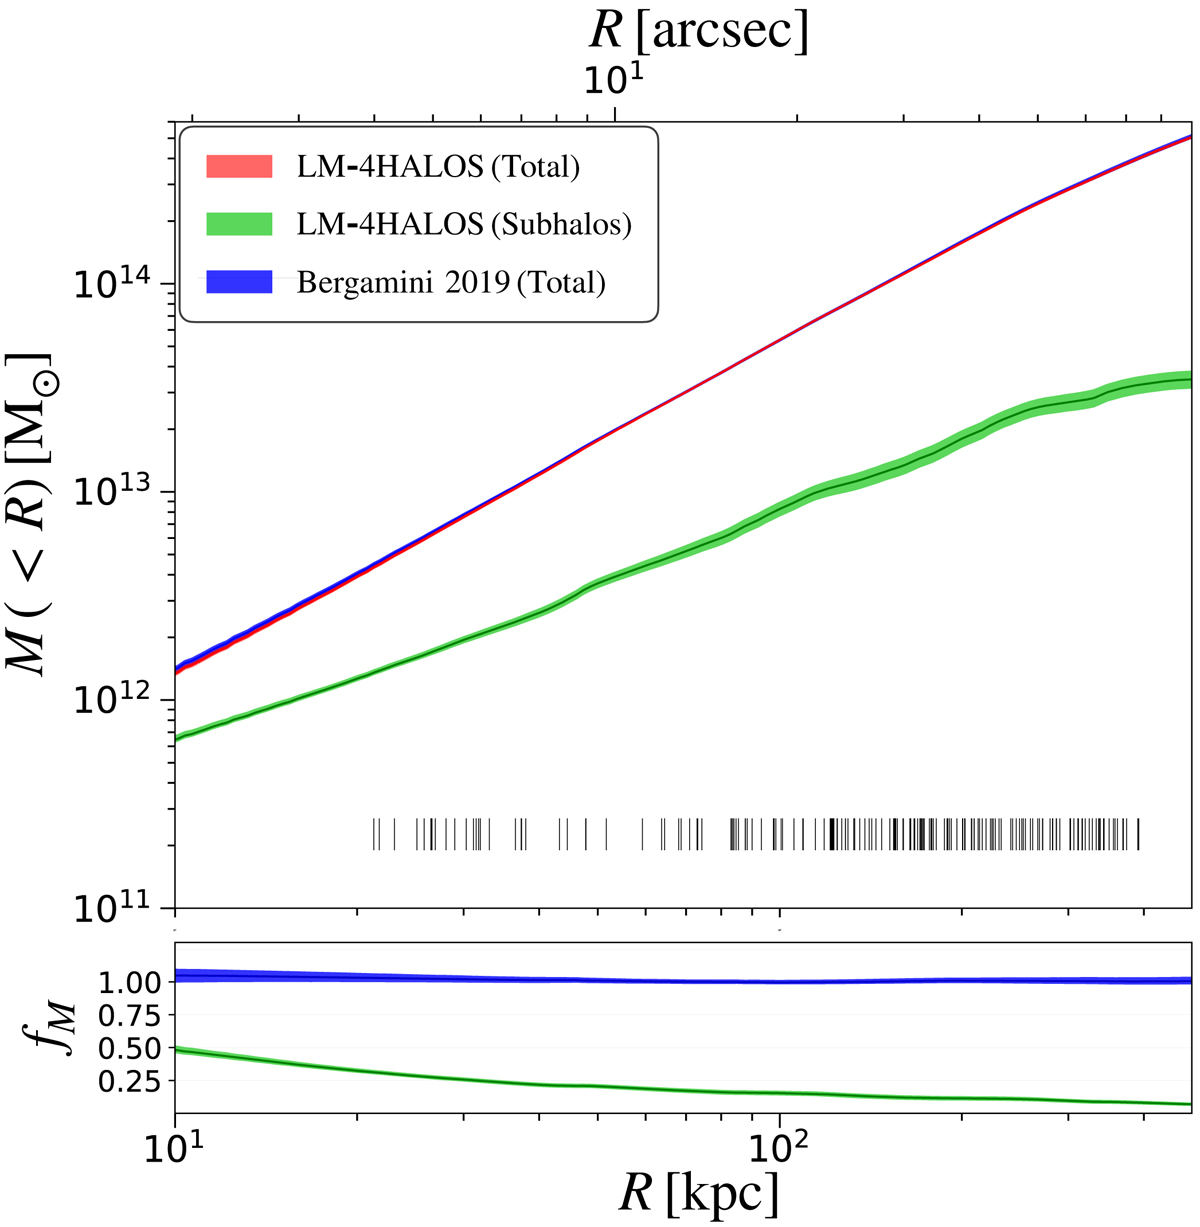
Top: cumulative projected total mass profile of MACS 0416 as a function of the distance (R) from the northern BCG. The red curve refers to the median and the 68% confidence level obtained from the reference lens model. The previous result by B19 is plotted in blue. The total mass of the subhalos, associated to cluster galaxies, is shown in green. Black vertical segments mark the positions of the 182 multiple images. Bottom: ratio between the new mass profile and the one from B19 (blue) and fractional contribution of the subhalo component to the total cumulative mass (in green).
Current usage metrics show cumulative count of Article Views (full-text article views including HTML views, PDF and ePub downloads, according to the available data) and Abstracts Views on Vision4Press platform.
Data correspond to usage on the plateform after 2015. The current usage metrics is available 48-96 hours after online publication and is updated daily on week days.
Initial download of the metrics may take a while.