Fig. 12.
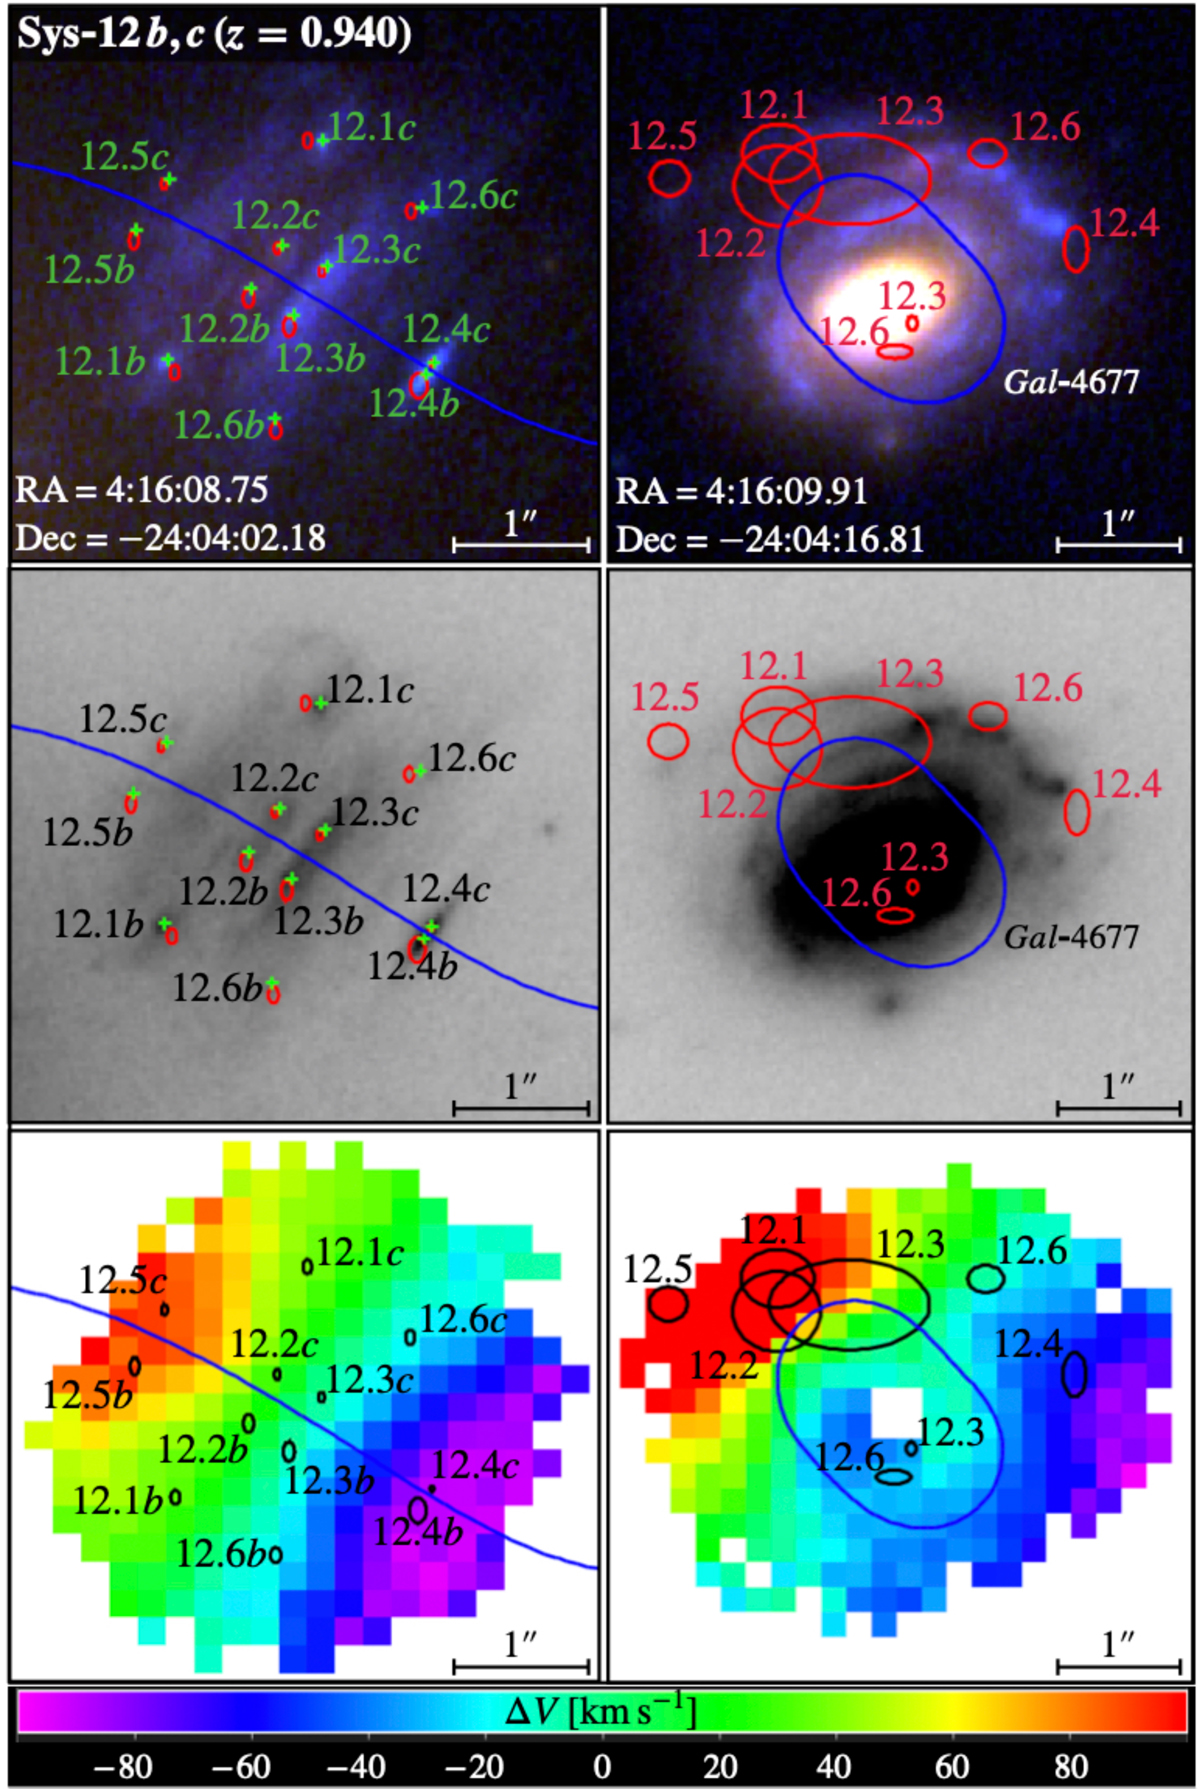
Detailed analysis of the lensed system 12 at z = 0.940. In the top and middle left panels, six point-like clumps (12.1…12.6) are identified within the lensed images a and b, straddling the critical line at z = 0.940 (blue line). Green crosses mark the positions of the observed multiple images. Red ellipses show the positions predicted by the LM-4HALOS reference lens model, with sizes corresponding to 1-σ errors along the x and y directions. The top and middle right panels show the third lensed image predicted by the lens model (blue spiral structure around the cluster galaxy Gal-4677). The blue line is the associated critical line; the red ellipses correspond to the predicted multiple images. In the top panels, RGB cut-outs combine F814W, 606W, F435W filters, while in the middle panels we show median stack images with the same filters. The bottom panels show the corresponding velocity maps obtained by tracing the shift of the [OII] emission doublet in the MUSE datacube (around ∼ 7229 Å at z = 0.940). The same red ellipses as in the upper panels are plotted in black for clarity.
Current usage metrics show cumulative count of Article Views (full-text article views including HTML views, PDF and ePub downloads, according to the available data) and Abstracts Views on Vision4Press platform.
Data correspond to usage on the plateform after 2015. The current usage metrics is available 48-96 hours after online publication and is updated daily on week days.
Initial download of the metrics may take a while.