Fig. 11.
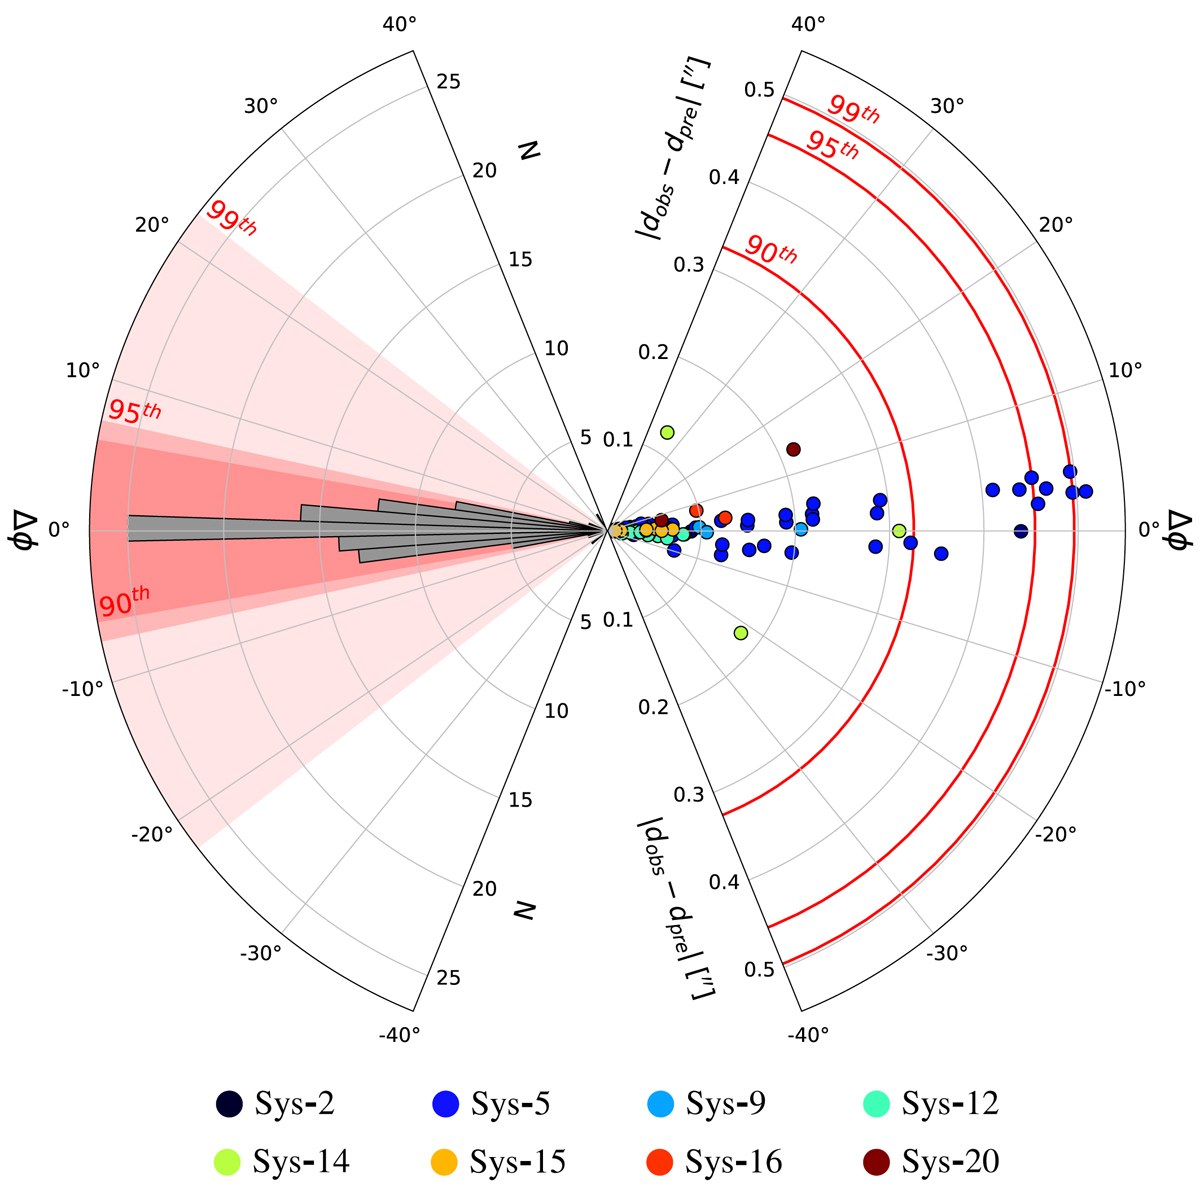
Difference between the observed and model-predicted separations and orientations of each pair of clumps (or knots) identified within eight systems of multiple images (see Fig. 2). Each dot corresponds to a different pair of clumps, colored according to the parent system. We define ![]() (
(![]() ) as the measured (predicted) distance between the ith and jth clump belonging to the same resolved lensed image (e.g., i = 12.1c, j = 12.5c in the top left panel of Fig. 12). We plot the absolute difference
) as the measured (predicted) distance between the ith and jth clump belonging to the same resolved lensed image (e.g., i = 12.1c, j = 12.5c in the top left panel of Fig. 12). We plot the absolute difference ![]() along the radial axis on the right side, while the angle (Δϕij) between
along the radial axis on the right side, while the angle (Δϕij) between ![]() and
and ![]() vectors (measured counterclockwise) is plotted across the angular coordinate. On the left side of the diagram, we draw a binned distribution of all the data-points. The 90th, 95th, and 99th percentiles of the distributions along the radial and angular directions are shown as red semi-circles and sectors respectively.
vectors (measured counterclockwise) is plotted across the angular coordinate. On the left side of the diagram, we draw a binned distribution of all the data-points. The 90th, 95th, and 99th percentiles of the distributions along the radial and angular directions are shown as red semi-circles and sectors respectively.
Current usage metrics show cumulative count of Article Views (full-text article views including HTML views, PDF and ePub downloads, according to the available data) and Abstracts Views on Vision4Press platform.
Data correspond to usage on the plateform after 2015. The current usage metrics is available 48-96 hours after online publication and is updated daily on week days.
Initial download of the metrics may take a while.