Fig. 1.
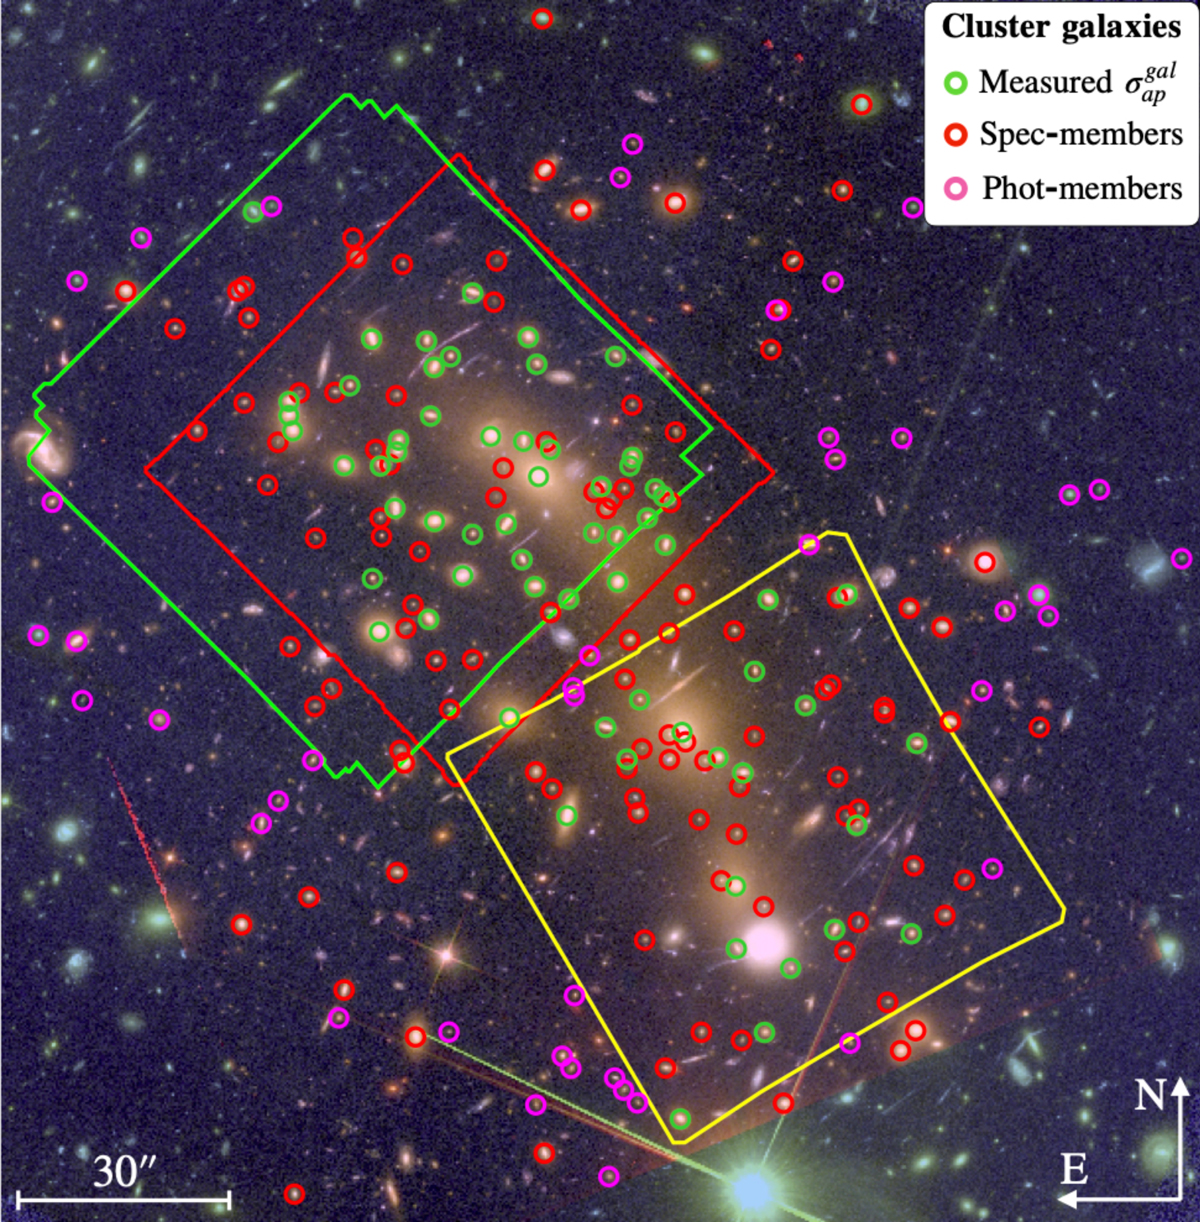
RGB image (F105W+F125W+F140W+F160W, F606W+F814W, F435W) of MACS 0416 showing the footprints of the northeast and southwest MUSE pointings in red and yellow, respectively. The new deep MUSE observation in NE region, totaling to 17.1h, is shown in green. Circles mark the 213 cluster galaxies included in our lens models. Red and green circles refer to the 171 spectroscopic members. Green circles correspond to the 64 cluster galaxies for which we measure a reliable internal velocity dispersion from MUSE spectra. The remaining 42 photometric members are encircled in magenta.
Current usage metrics show cumulative count of Article Views (full-text article views including HTML views, PDF and ePub downloads, according to the available data) and Abstracts Views on Vision4Press platform.
Data correspond to usage on the plateform after 2015. The current usage metrics is available 48-96 hours after online publication and is updated daily on week days.
Initial download of the metrics may take a while.