| Issue |
A&A
Volume 645, January 2021
|
|
|---|---|---|
| Article Number | A78 | |
| Number of page(s) | 10 | |
| Section | Astrophysical processes | |
| DOI | https://doi.org/10.1051/0004-6361/202039379 | |
| Published online | 14 January 2021 | |
Super-Eddington accretion in the Q2237+0305 quasar?
1
Institute of Radio Astronomy of the National Academy of Sciences of Ukraine, 4 Mystetstv, 61002 Kharkov, Ukraine
e-mail: This email address is being protected from spambots. You need JavaScript enabled to view it.
, This email address is being protected from spambots. You need JavaScript enabled to view it.
, This email address is being protected from spambots. You need JavaScript enabled to view it.
2
Institute of Astronomy of Kharkov National University, Sumskaya 35, 61022 Kharkov, Ukraine
3
V.N. Karazin Kharkov National University, Svobody Sq. 4, 61070 Kharkov, Ukraine
4
College of Physics, International Center of Future Science, Jilin University, 2699 Qianjin St., 130012 Changchun, PR China
Received:
9
September
2020
Accepted:
3
November
2020
Abstract
The interband time lags between the flux variations of the Q2237+0305 quasar have been determined from light curves in the Johnson-Cousins V, R, and I spectral bands. The values of the time lags for filter pairs R − V, I − R, and I − V are significantly higher than those predicted by the standard accretion disk model by Shakura and Sunyaev. To explain the discrepancy, the idea of a supercritical accretion regime in quasars considered in 1973 by Shakura and Sunyaev is applied. This regime has been shown by them to cause an extended scattering envelope around the accretion disk. The envelope efficiently scatters and re-emits the radiation from the accretion disk and thus increases the apparent disk size. We made use of analytical expressions for the envelope radius and temperature derived by Shakura and Sunyaev in their analysis of super-Eddington accretion and show that our results are consistent with the existence of such an envelope. The corresponding parameters of the accretion regime were calculated. They provide the radii of the envelope in the V, R, and I spectral bands consistent with the inter-band time lags determined in our work.
Key words: accretion, accretion disks / quasars: individual: Q2237+0305 / methods: data analysis
© ESO 2021
1. Introduction
Flux variability inherent in active galactic nuclei (AGNs) and quasars is an important source of information about their physical properties and therefore has been closely investigated by astronomers for decades (see, e.g., Cristiani et al. 1997; Giveon et al. 1999; Vanden Berk et al. 2004; Wilhite et al. 2005; Magdis & Papadakis 2006; Gopal-Krishna et al. 2013; Kumar et al. 2015; Grier et al. 2019; Yi et al. 2019; Kokubo & Minezaki 2020; Luo et al. 2020). The variability is observed in all spectral regions, from the X-rays to radio wavelengths, and at timescales from a few days to several years (Giveon et al. 1999; Webb & Malkan 2000; Wilhite et al. 2005; Schmidt et al. 2012). The characteristic amplitudes grow toward longer time lags and shorter wavelengths. The flux variations in AGNs and quasars in different spectral bands are often observed with certain time lags between them. This may suggest that these time lags measure the light travel times between the quasar regions that radiate in different spectral bands. It may therefore be a useful instrument for studying spatial structure and physical parameters of AGNs and quasars. This instrument, called “reverberation mapping” (RM), was initially proposed for measuring the distance between the central region of a quasar that is responsible for the hard continuum radiation and a broad emission line region (Blandford & McKee 1982). Initially, RM implied spectroscopic observations. The so-called photometric RM has been widely used recently (e.g. Bachev 2009; Edri et al. 2012; Jiang et al. 2016; Mudd et al. 2018; Kokubo 2018). The photometric RM implied photometry in two or more spectral bands. Some of them contained emission lines and others did not.
In 1997, Wanders et al. (1997) reported reverberation time delays measured in their spectroscopic RM campaign with the International Ultraviolet Explorer (IUE). The authors noted that the most remarkable result is the detection of apparent time shifts between the brightness variations in different regions of the UV continuum. Collier et al. (1999) later realized that the optical continuum variations lag the UV variations in NGC 7469. Further photometric RM projects provided much evidence of lags between flux variations observed in continua of different spectral regions (e.g., Collier 2001; Sergeev et al. 2005; Cackett et al. 2007; Bachev 2009; Fausnaugh et al. 2016, 2018; Mudd et al. 2018). Currently, several major international projects are dedicated to RM of quasars and AGNs, such as the Sloan Digital Sky Survey Reverberation Mapping (SDSS-RM), the Space Telescope and Optical Reverberation Mapping (STORM), the Lick AGN Monitoring Project (LAMP), the Dark Energy Survey (DES), and others (Grier et al. 2017; Fausnaugh et al. 2018; Mudd et al. 2018; Homayouni et al. 2019; Kinemuchi et al. 2020; Yu et al. 2020).
The UV/optical radiation from quasars is generally believed to come from a geometrically thin optically thick accretion disk with a supermassive black hole in its center. According to this model (Shakura & Sunyaev 1973), the accretion disk temperature varies along the disk radius as T ∝ r−3/4, therefore the shorter-wavelength radiation must originate closer to the accretion disk center. According to the continuum thermal reprocessing scenario proposed by Krolik et al. (1991), its variations must therefore precede those observed at longer wavelengths. The expected trend of time lags with wavelength must therefore follow the relationship τ ∝ λ4/3, provided the accretion disk radiates as a blackbody.
The paper contains photometric RM results and their analysis applied to the V, R, and I light curves of Q2237+0305 (nicknamed “the Einstein Cross”, discovered by Huchra et al. (1985), which is one of the most famous gravitational lens systems with a radio-quiet quasar at zq = 1.695 that is quadruply lensed by a zg = 0.039 Sab galaxy. Four individual macroimages labeled A through D are arranged in a cross-like pattern around the galaxy nucleus within a circle of approximately 1.8 arcsec in diameter. Until recently, there were two determinations of the interband time delays for a quasar of the Q2237+0305 lens system (Koptelova et al. 2006, 2010). In both works a cross-correlation analysis was applied to the light curves in filter V obtained by the OGLE collaboration (Udalski et al. 2006) and the R light curves built from observations at the 1.5-m telescope of the Maidanak observatory. The time delays between the variations in these two spectral bands were reported in Koptelova et al. (2006) to be 9 days for image A and 16.2 days for image C. Koptelova et al. (2010) reported time lags of 5.1−5.6 days and 5.1−5.2 days for images A and C, respectively. In addition to different sampling rates and time coverage, the two datasets used in the two works were processed with different photometry algorithms, therefore we decided to repeat the work with more homogeneous data. To do this, we turned to the monitoring data of the Q2237+0305 system in filters V, R, and I in 2001−2008, presented by Dudinov et al. (2011). Preliminary processing of the 2004−2005 light curves in filters V and R has definitely shown that the variations in filter R lag those in V by about 5 days (Berdina et al. 2018, 2019). We show the results of processing the data of two seasons in all the three filters, V, R, and I, with a more careful analysis of errors and a subsequent discussion of possible mechanisms leading to the particular values of the interband time delays and their behavior in wavelengths.
In the next section, we describe the initial data we used and discuss their suitability for determining the interband time delays in Q2237+0305.
2. Initial data and time lags
Of all the existing monitoring data for Q2237+0305, the detailed light curves in filter V obtained in the framework of the OGLE program (Udalski et al. 2006) are the most famous. Their high photometric accuracy, rather good sampling and time coverage made the OGLE light curves a basis for various microlensing studies, which provided many estimates of the Q2237+0305 lens parameters.
2.1. Initial data
A similar dataset exists that is much less well known because it was published in a poorly accessible journal (Dudinov et al. 2011). While the OGLE data are more accurate and cover longer observing seasons, the data by Dudinov et al. (2011) have the advantage that they have been obtained through three filters, – V, R, and I of the Johnson-Cousins photometric system. The effective wavelengths are λeff(V) = 545.7 nm, λeff(R) = 634.9 nm, and λeff(I) = 879.7 nm, which correspond to λrest(V) = 203.2 nm, λrest(R) = 235.6 nm, and λrest(I) = 326.4 nm in the Q2237+0305 quasar source plane (zq = 1.695). Photometry spanning eight years, from 2001 to 2008, is available at the site of the IA of the V.N. Karazin National University1. In Fig. 1 we reproduce the light curves of Q2237+0305 for the 2004 and 2005 seasons built from the data by Dudinov et al. (2011). General information about the V, R, and I light curves for the 2004 and 2005 seasons is given in Table 1.
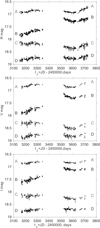 |
Fig. 1. Light curves of Q2237+0305 in filters V, R, and I from observations by Dudinov et al. (2011). The data for the seasons in 2004 and 2005 are presented. |
General information about the data of observations of Q2237+0305 used to determine the interband time delays in this work.
The light curves by Dudinov et al. (2011) and those in filter R used by Koptelova et al. (2006, 2010) were obtained from the same monitoring data taken with the 1.5-m telescope of the Maidanak Observatory, but they were processed with different photometry algorithms, as described in Vakulik et al. (2004), Dudinov et al. (2011), and Koptelova et al. (2005).
Measurements of the interband time delays in gravitationally lensed quasars encounter almost the same difficulties as those that are inherent in measuring the single-band time delays between the quasar macroimages. These are listed and analyzed in detail by Tewes et al. (2013), for instance. In addition to the known difficulties, which are common for all time-delay lenses (finite photometric accuracy, poor and irregular sampling, gaps between the seasons, variable microlensing), the microlensing events in Q2237+0305 are very frequent; the amplitudes vary from several hundredths of a magnitude to about 1 mag (see the light curves by Udalski et al. 2006; Dudinov et al. 2011). Dudinov et al. (2011) estimated the contributions from the source intrinsic variability and microlensing variability into the total flux variations of the Q2237+0305 macroimages during 2000−2008. The two constituents of variability were found to contribute almost equally to the root mean square (rms) variation of the Q2237+0305 light curves in 2001−2008.
As microlensing events occur in each macroimage independently, they may cause dramatic mutual distortions of their light curves. An adequate elimination of microlensing effects is therefore vital to obtain the unbiased estimates of the time delays between macroimages. A pair of light curves in two different filters of the same macroimage can be anticipated to be less mutually distorted by microlensing: observations show only a smooth growth of microlensing amplitudes toward the shorter wavelengths, but the effects of microlensing still have to be eliminated. To measure the interband time delays, we therefore applied the method developed by us earlier for determining the differential time delays in gravitationally lensed quasars in the presence of microlensing. In short, the method uses some useful properties of representing the data of observations by the orthogonal polynomials, which provide certain simplicity and convenience in calculations. In particular, it allows any term of the polynomial that approximates a particular light curve to be eliminated or added again without requiring to recalculate the remaining expansion coefficients. This property is useful, in particular, to determine the time delays in the presence of microlensing. A detailed description of the method can be found in Tsvetkova et al. (2016), where its application is demonstrated in determining the single-band time delays between macroimages of the PG 1115+080 and HE 0435−1223 gravitationally lensed quasars. In Fig. 2 we show the polynomial approximations provided by our method for the light curves in Fig. 1: the curves are reduced to the same magnitude level, and the first-order terms are eliminated.
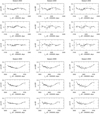 |
Fig. 2. Polynomial approximations for the light curves in Fig. 1: the curves are reduced to the same magnitude level, and the first-order terms are eliminated (Δm is the brightness variations in magnitude relative to the average level for a given season). |
An additional factor restricting the accuracy of determining time delays is the character of the intrinsic quasar variability. In order to be suitable for determining the time delays, the intrinsic quasar variability curves must contain features with a characteristic timescale shorter than (or at least on the order of) the expected value of the time delay, and with the amplitudes exceeding the photometry errors inherent in observations. Unfortunately, this is not always the case with Q2237+0305. Figure 1 shows that the light curves of the 2004 and 2005 seasons in filter R have a rather long time coverage and are sampled densely enough, with an almost daily cadence that is sometimes interrupted by short weather gaps. Although these curves do not fully meet the criteria indicated above, we decided to use them to determine the interband time delays. The V and I light curves shown in Fig. 1 are represented by a smaller number of data points than those in R, but not so few as to abandon the attempt of measuring the interband time delays.
2.2. Results and analysis of time delays
The time delays for three pairs of filters, τRV, τIR, and τIV calculated from the data of the 2004 and 2005 seasons are presented in Table 2 for each of the A, B, and C macroimages separately (Cols. 2, 4, and 6), as well as averaged over the components (Cols. 3, 5, and 7). We did not use the light curves of the faintest D component because the photometric accuracy is low. The positive values of the time delays mean that the light curves corresponding to the first letter in a subscript lag those corresponding to the second symbol.
Relative interband time lags τ (in days) of the Q2237+0305 quasar for the RV, IR, and IV pairs of light curves from the monitoring data by Dudinov et al. (2011) (in the observers’s coordinate system).
To estimate the errors of the time delays, we used the initial light curves modified in the following way. Up to 30% of the data points were excluded from an initial pair of light curves sequentially in a random manner, then the procedure of determining the time delay was applied for each such new realization of the light-curve pairs, and the corresponding new estimate of the time delay was obtained. A number of such trials reached 20, and then the average time-delay values were calculated for a set of such estimates. The value of the rms deviation from the average was taken as an error of our time-delay estimates. This approach to estimating the errors of measuring the time delays differs from the generally accepted approach. A pair of artificial model signals is usually synthesized, with the subsequent signal imposing various random noise realizations that imitate the scatter of the initial data points. Our approach is also valid. At least, it has the advantage that we need not worry whether the excepted random noise parameters (e.g., variance and probability density distribution) are adequate for the real characteristics of the photometry errors of the processes under comparison.
In Fig. 3 we show the histograms, which demonstrate the probability density distributions for the estimates of the time delays inherent in our measurements presented in Table 2. The histograms, far enough from being Gaussian, are nevertheless symmetric enough and have fairly clear maxima, with the exception of measurements for τRV in 2004 and, perhaps, in 2005.
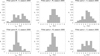 |
Fig. 3. Histograms of the probability density distribution P for the estimates of the interband time delays τRV, τIR, and τIV presented in Table 2. |
Our measurements thus show quite definitely that the quasar intrinsic flux variations in longer wavelengths lag those in shorter wavelengths for all the three pairs of spectral bands, in accordance with the thermal reprocessing scenario proposed by Krolik et al. (1991). For further consideration, we require that the time delays are reduced to the source coordinate system,  . This is shown in Table 3, where the estimates of
  ,
,  , and
, and  averaged over three macroimages are presented for two seasons separately. The 80% confidence intervals (CI) for the estimated time delays are also presented in this table.
We consider the time delays for the 2004 and 2005 seasons represented in Table 3 separately. We further used their values averaged over the seasons, which are (in days)
 (1)
(1)
Rest-frame time delays  of the Q2237+0305 quasar for the RV, IR, and IV pairs of light curves averaged over the three components, and the corresponding confidence intervals CI for the 80% confidence level.
The longest (and almost equal) time delays were obtained for the RV and IV pairs of light curves, although the wavelength bases for the filter pairs I − V and R − V differ by four times. The least value of the interband time delay was obtained for the intermediate wavelength base (and for the longest wavelength range of the filter pairs), namely, between the light curves in filters I and R. This result is inconsistent with the expected power-law dependence of the disk effective radius on wavelength, rλ1 = rλ0(λ1/λ0)ζ, with ζ = 4/3 for the standard thin accretion disk model. In the framework of the hypothesis that the radiation from the central region is reprocessed in its propagation toward the accretion disk periphery, there should be delays in the response at different wavelengths, which for the disk zones emitting at the effective wavelengths λ1 and λ0 can be written as
![Mathematical equation: $$ \begin{aligned} \tau = \frac{r_{\lambda _0}}{c} \left[\left(\frac{\lambda _1}{\lambda _0}\right)^{\zeta }-1\right], \end{aligned} $$](/articles/aa/full_html/2021/01/aa39379-20/aa39379-20-eq28.gif) (2)
(2)
where c it is the velocity of light.
We used here a somewhat simplified scheme for emerging reverberation responses, which admits that they are formed for each of the filters in some annular zones of an accretion disk. The zones are located at the distances from the central source where the temperatures match the passbands of the corresponding filters. An initial signal (fluctuations of the hard radiation from the central source region) in its propagation toward the disk periphery is reprocessed into the longer-wavelength signals with the time lags determined by the proper light travel times. At the same time, the initial signal undergoes distortions, which are due to sizes, shapes, and positions of the re-emitting regions. According to our simplified scheme, the observed distortion of the initial signal in time (transfer function, or, more exactly, response function) is determined in particular by the width and brightness profile of a specific emitting zone, azimuthal distribution of the zone surface brightness, and finally, by the inclination of the disk plane with respect to the plane of the sky.
In each specific case, all these factors are unknown, or are known with a high degree of uncertainty. To construct the response function, model representations are therefore commonly used, which are simplified as a rule. In our case, the simplification implies that the widths and brightness of the annular zones do not change in azimuth. The width of the response function is then determined by a temperature profile of the annular zone, which matches the corresponding filter passband, while the effect of the disk inclination is reduced to additional broadening of the response function by ±(r sin i)/c, where i is the inclination angle, and c is the velocity of light. It is important that the broadening is symmetric with respect to the initial signal arrival time at a distance r from the source.
Poindexter & Kochanek (2010) have concluded from the analysis of microlensing events in Q2237+0305 that the accretion disk in this quasar is observed virtually face-on (cos i = 0.66). It is easy to calculate that for this inclination, broadening of the response function for the zone radius, for example, r = 2 × 1016 cm, will be approximately ±2 days. The effect of a response function with such a width on the initial signal with a characteristic variability timescale of a few dozen days and longer will result only in its insignificant smoothing, while the symmetric nature of the response function will ensure the absence of biases in estimates of the interband time delays.
3. Discussion
3.1. Comparison with the classical thin-disk model
For the standard thin accretion disk by Shakura & Sunyaev (1973), the radius rλ (the disk scale length) where the disk temperature reaches the photon energy,  , is given by the expression (Poindexter & Kochanek 2010; Frank et al. 2002)
 (3)
(3)
where G is the gravitational constant, h is the Planck constant, c is the light speed,  is the rest-frame wavelength, and MBH and Ṁ are the black hole mass and accretion rate, respectively.
Poindexter & Kochanek (2010) and Morgan et al. (2010) proposed the following form of expression (3):
 (4)
(4)
where dimensionless quantities MBH/109 M⊙ and  m are introduced, L and LEdd are the disk luminosity and the Eddington luminosity limit, LEdd = 1038 ⋅ (MBH/M⊙) erg s−1, and η is the accretion efficiency, which varies from 0.06 for the Schwarzshild black hole to 0.4 for the Kerr black hole. Frank et al. (2002) proposed considering η = 0.1 as a reasonable value when other information is absent. L is also often assumed to be equal to LEdd, thus providing the upper limit to the estimate of rλ.
For Q2237+0305, several MBH determinations are available in the literature. We have collected most of them in Table 4 and indicate the method used for the determination. The estimates vary almost by an order of magnitude depending on the method. For example, adopting MBH = 9 × 10⁸ M⊙ by Morgan et al. (2010), we obtain from Eq. (4) the following values of radii (in centimeters) for the rest-frame wavelengths corresponding to filters V, R, and I:
 (5)
(5)
Estimates of the black hole mass in the Q2237+0305 quasar collected from the works published during 2000−2015.
These values are generally consistent with the determinations of the effective accretion sdisk size in Q2237+0305 made from observations of microlensing events. Most of them are collected in Table 5, where r1/2 is the so-called half-light radius equal to 2.44 rλ (Poindexter & Kochanek 2010).
Half-light radius r1/2 of the Q2237+0305 quasar accretion disk determined in different works from the analysis of microlensing events.
Accordingly, we may expect the following quantities for the distances between the disk zones that radiate in the corresponding spectral bands:
 (6)
(6)
Using a simplified model for the occurrence of the reverberation responses described above, we therefore obtain the following values of the interband time delays (in days) predicted by the standard thin disk model:
 (7)
(7)
Uncertainties in quantities (5)–(7) were calculated adopting the formal uncertainty in the MBH determination from the line widths to be equal to approximately 0.1 dex (Morgan et al. 2010). It should be noted that some authors have reported less optimistic errors for the broadline and reverberation mapping estimates of MBH (e.g., Kollmeier et al. 2006; Kelly et al. 2008).
The interband time delays calculated with the use of Eq. (4) are noticeably shorter than those determined in the present work (Table 3 and the quantities in Eq. (1) averaged over the two seasons). The discrepancy is large enough and needs to be discussed.
3.2. The problem of large accretion disk radii
We are not the first to encounter this discrepancy between the measured reverberation time lags and those predicted by the standard accretion disk model. In particular, Morgan et al. (2010), Edelson et al. (2015), Kokubo (2018), and the DES and STORM project participants (Fausnaugh et al. 2016, 2018; Mudd et al. 2018) pointed out that the measured time delays between the quasar flux variations in different spectral regions are often noticeably longer than the expected values derived within the standard model of a thin accretion disk. The evident explanation of this discrepancy might imply that the observed reverberation responses arise in some extended disk regions located somewhere at the disk periphery.
The idea of the existence of such a structure has repeatedly been expressed in a number of earlier works dedicated, for instance, to the analysis of flux ratio anomalies, or interpreting the results of microlensing studies in some gravitationally lensed quasars (Witt & Mao 1994; Pooley et al. 2007; Vakulik et al. 2007; Shulga et al. 2014). The similar discrepancy between the measured dimensions of quasars and those derived from their luminosities has also been discussed by Dai et al. (2003), Poindexter et al. (2008), Morgan et al. (2010), and Poindexter & Kochanek (2010). Jaroszynski et al. (1992) were the first to admit the existence of an extended outer structure in the Q2237+0305 accretion disk in their simulations of microlensing events. They noted that such a structure could add 100% more light to the thin-disk radiation in B and R. They suggested that this additional light could be the radiation from the disk reprocessed in the outer regions of the quasar. This extended structure does not experience microlensing, but damps the microlensing peaks produced by the compact inner parts of the disk. Schild & Vakulik (2003) and Vakulik et al. (2007) have shown that a two-component quasar structure model consisting of a central compact source and an extended outer feature is capable of better reproducing in simulations the observed amplitudes of microlensing light curves than the central source alone.
The accretion disk models predict a power-law dependence of the disk effective radius on wavelength, rλ ∼ λζ, with ζ = 4/3 for the standard thin accretion disk. For Q2237+0305, there are several determinations of the exponent values based on observations of chromatic microlensing events, which are rather well (Eigenbrod et al. 2008) or marginally (Anguita et al. 2008; Munoz et al. 2016) consistent with the thin-disk model predictions. However, an analysis of multiwavelength data for 12 objects presented by Blackburne et al. (2011) not only confirmed the abnormally large disks for most of the objects, but also demonstrated a noticeable diversity of the disk radii dependences on wavelength.
3.3. Scattering envelope around the black hole?
These discrepancies between the results of observations and predictions made from a standard disk model are important indications that the real accretion disk may noticeably differ from the model. A possible scenario for the emergence of an extended structure around the accretion disk was considered several decades ago in the classical work by Shakura & Sunyaev (1973). They analyzed a supercritical accretion mode, which is characterized by the luminosity fixed at the Eddington limit Lcr = 1038M/M⊙ erg s−1 and by a high accretion rate, Ṁ > Ṁcr, where Ṁcr = Lcr/ηc2, as well as by a low value of the efficiency α of the angular momentum transport in the accreting matter, α ≪ 1. According to the classical accretion disk model, the disk thickness increases with distance to the black hole, providing the possibility that the outer regions of the disk intercept a portion (from 0.1 to 10%) of the hard radiation of the central regions and re-emit it in the UV and optical continuum, as well as in emission lines of various elements. Shakura & Sunyaev (1973) showed that in the supercritical regime, when Ṁ ≫ Ṁcr and α ≪ 1, an optically thick scattering envelope is formed, which increases the apparent disk size. They gave analytical expressions for the effective temperature Teff and radius reff of such an envelope,
 (8)
(8)
 (9)
(9)
Here, dimensionless parameters are introduced: m = M/M⊙, ṁ = Ṁ/Ṁcr. Parameter A characterizes a ratio of energy losses in the Compton processes to those in the free-free transitions. For physical conditions of interest in this particular considerations, A is noted to vary from 10 to 300 (Shakura & Sunyaev 1973). They also pointed out that the temperature Teff is virtually constant in the regions with r > reff. The authors further point out that in the optical wavelengths which correspond to low-frequency spectral range at the discussed temperature Teff the radius near which the envelope becomes opaque exceeds reff considerably. Setting the value of the optical opacity equal to unity, the authors obtained the following expression for the optical envelope radius (in centimeters):
 (10)
(10)
where (106°K)/T and (1015 Hz)/ν are dimensionless temperature and frequency, respectively.
In Table 6 we show the values of Teff, reff, and ropt that were calculated for two pairs of parameters α and A selected arbitrarily within the range of their permissible values indicated above, namely, for α = 0.05 and A = 100, and α = 0.1 and A = 50. The black hole mass was taken from Table 4 to equal MBH = 9 × 10⁸ M⊙, and the dimensionless accretion rate was adopted to be ṁ = 17, according to Morgan et al. (2010) and Abolmasov & Shakura (2012). Table 6 shows that the supercritical regime provides values of ropt that are steadily higher than those predicted by the standard thin-disk model. The reverberation signals at these radii can therefore be expected to exhibit longer time lags.
To reveal the regions of parameters α and A that provide the best fit between the time delays determined in our work and those calculated for the radii ropt according to expression (10), we plot the difference maps between the measured and predicted values of the interband time lags. The maps built in coordinates α and A for each of the three filter pairs separately are shown in Fig. 4. The difference values are reproduced in grades of gray shown at the right edge of each row. The brightest regions correspond to the smallest difference between the reverberation time delays calculated according to Eq. (10) and those measured in the present work. Rather vast areas in coordinates α and A provide the values of the interband time delays predicted with the use of Eqs. (2) and (10) consistent with our measurements. These areas are clearly seen to shift toward the higher values of α for the longer wavelength range. This is consistent with the analysis of the supercritical regime by Shakura & Sunyaev (1973), who noted that parameter α can (and must) depend on the disk radius. In particular, for the turbulent mechanism of the angular momentum transport, α can be about 1 at the disk periphery, while closer to the black hole, where the accretion picture becomes spherical, parameter α ∼ 10−3.
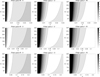 |
Fig. 4. Difference maps between the interband time delays determined in the present work and calculated according to Eqs. (2) and (10). The brightest regions correspond to the smallest difference between these values. The maps are built for three black hole masses, from top to bottom: MBH = 2 × 10⁸ M⊙, MBH = 9 × 10⁸ M⊙, and MBH = 20 × 108 M⊙. |
Another quantity that may serve as an indicator of the accretion regime in a particular object is the Eddington ratio, Lbol/LEdd. We followed Agol et al. (2009) and adopted Lbol = 4 × 1046 erg s−1 for the bolometric luminosity of Q2237+0305 and calculated LEdd = 1.3 × 1038(MBH/M⊙) erg s−1 for the black hole mass MBH = 9 × 10⁸ M⊙ (Morgan et al. 2010, see also Table 4). We obtained Lbol/LEdd ≈ 0.34.
Collin et al. (2002) have analyzed the statistical relation between the Eddington ratios Lbol/LEdd and black hole masses for 34 objects from the Kaspi et al. (2000) sample of the PG quasars for which the black hole masses are known. They reported that 11 objects have super-Eddington luminosities, and 7 have luminosities higher than 0.3 LEdd, that is, more than a half of the objects are inconsistent with the geometrically thin-disk model.
Similar studies have been carried out by Kollmeier et al. (2006) using 407 AGNs from the AGN and Galaxy Evolution Survey (AGES). Their Lbol/LEdd − MBH plot exhibits condensation of the data points (a ridge of a sort) at Lbol/LEdd ≈ 1/4, and demonstrates quite convincingly the lack of AGNs at a factor of approximately 10 below Eddington. They note that this can be regarded as strong evidence that supermassive BHs gain most of their mass while radiating close to the Eddington limit. The distributions of Lbol/LEdd built both at fixed BH mass and at fixed luminosity are log-normal and have rather sharp peaks near Lbol/LEdd ≈ 1/4, thus confirming that the sample consists mostly of AGNs radiating near the Eddington limit. With these two works taken into account, we conclude that the Q2237+0305 quasar can be considered as an object radiating fairly near the Eddington limit.
4. Conclusions
The scenario that an extended optically thick envelope forms in the supercritical accretion regime considered by Shakura & Sunyaev (1973) therefore is in principle capable of explaining the high values of the interband time delays obtained in our work. The analysis of the supercritical regime and of its possible observational manifestations developed further in Abolmasov & Shakura (2012) and Shakura (2018) has also been considered in simulations (e.g., Ohsuga et al. 2005; Okuda et al. 2005; Volonteri et al. 2015; Sakurai et al. 2016; Jiang et al. 2019; Pinto et al. 2020, and others). The results of some observations have also made their authors consider the suggestion that some quasars may accrete in the super-Eddington regime (Collin et al. 2002; Kollmeier et al. 2006; Lanzuisi et al. 2016; Jin et al. 2017; Liu et al. 2019).
As we noted in Sect. 2, the behavior of our estimates of the interband time delays in wavelengths is not only inconsistent with the theoretic expectations, but is also very strange: almost equal τRV and τIV and very short τIR. Although the uncertainties of determining the time lags presented in Table 3 are large enough, we would like to draw attention to the low τIR value. Distracting from a possible physical reason, we note that if the values of τRV and τIV are really close to each other, the values of τIR must be low indeed, that is, the low τIR estimate can be regarded as an argument that τRV and τIV are measured correctly.
The time delays τRV, τIR, and τIV measured in our work therefore appear to indicate that the disk radius ceased to depend on the wavelength after the zone in which the blackbody temperature corresponds to the passband of filter R. Theoretic analyses made by Shakura & Sunyaev 1973, as well as presented later in Abolmasov & Shakura (2012) and Shakura (2018) showed that scattering envelopes not only provide larger apparent disk sizes, but make their size less dependent on wavelength when scattering by free electrons is the main source of the envelope opacity. Numerical simulations also predict a constant temperature for the outer layers of the envelope, namely, for an optical depth less than 5 (Hubeny & Hubeny 1998). Abolmasov & Shakura (2012) also noted that an extended scattering envelope can be expected to spatially mix the radiation from different disk zones. These peculiarities of the envelope may qualitatively explain the abnormal behavior of our estimates of the interband time lags in wavelengths.
Before we summarise, we add one more comment about the high values of the reverberation time lags. As we indicated above, our measurements are inconsistent not only with the thin-disk model predictions, but also with the results of many microlensing observations of Q2237+0305. This is easily explained by the fact that microlensing events and reverberation responses concern different spatial scales of the accretion disks, with the smaller of them referring to microlensing. As numerical calculations by Jaroszynski et al. (1992) have shown, the caustic crossing events are most sensitive to the structure of the inner regions of the disk, while the extended outer regions may only contribute to the observed amplitudes of microlensing events. We summarise our results below.
-
We have measured the interband time delays between the light curves of the Q2237+0305 macroimages in filters V, R, and I to be
 ;
;  , and
, and  days (in the source coordinate frame), with flux variations in longer wavelengths lagging those in the harder range of the spectrum, in accordance with the reprocessing scenario.
 -
These delays indicate that the observed reverberation responses arise in structures located at distances from the central black hole that exceed the radii of the corresponding regions of the accretion disk predicted by the standard thin-disk model.
-
An explanation for this discrepancy is sought within the assumption about a super-Eddington accretion regime in quasar Q2237+0305, which leads to the formation of an extended scattering envelope (atmosphere) around the central black hole.
-
Based on a theoretical analysis of the super-Eddinton accretion and physical properties of the envelope reported by Shakura & Sunyaev (1973), Abolmasov & Shakura (2012), and Shakura (2018), we tested whether the observed reverberation responses might be formed in the corresponding zones of the envelope.
-
We showed that for certain values of the parameters α and A (angular momentum transport efficiency and the ratio of energy losses in the Compton processes to those in the free-free transitions), the super-Eddington regime provides values of the envelope radius that are noticeably higher than those predicted by the standard thin-disk model. The reverberation signals at these radii can therefore be expected to exhibit longer time lags, consistent with our measurements.
-
To reveal the regions of parameters α and A that provide the best fit between the interband time delays determined in our work and those based on the analysis of the super-Eddington accretion regime by Shakura & Sunyaev (1973), we plotted the difference maps between these values in coordinates α and A (Fig. 4). The areas of the best fit of our results to those expected from the Shakura & Sunyaev (1973) analysis of the super-Eddington regime are clearly seen to shift towards the higher values of α for the longer wavelength range. This is consistent with their indication that parameter α can (and must) depend on the disk radius.
-
The Eddington ratio, Lbol/LEdd, is also an important quantity that may serve as an indicator of the accretion regime in a particular object. When we adopt, according to Agol et al. (2009), LEdd = 4 × 1046 erg s−1 for the Q2237+0305 bolometric luminosity and regard the black hole mass MBH = 9 × 10⁸ M⊙ by Morgan et al. (2010) as known with an uncertainty of 0.3 dex, we obtain 0.26 < Lbol/LEdd < 0.41 for the possible value of the Q2237+0305 Eddington ratio. Comparing this with the results by Collin et al. (2002) and Kollmeier et al. (2006), who reported that most objects from their samples have Eddington ratios higher than 0.3 (Collin et al. 2002) or 0.25 (Kollmeier et al. 2006), we conclude that the Q2237+0305 quasar can be considered as an object that radiates fairly near the Eddington limit. It is therefore capable of developing an optically thick scattering envelope that changes the observed structural properties of the accretion disk.
Acknowledgments
The authors would like to thank the colleagues from IRA of the NAS of Ukraine and IA of the KhNU for the fruitful discussions of the problems raised in the present work. L. Berdina is grateful to the EAS/Springer (2018) and EPS (2019) grants which have provided an opportunity to report preliminary results of the present work at conferences. V. Tsvetkova would like to acknowledge the role of R.E. Schild in giving rise to the RM studies in Kharkov, who tried to draw attention to the problem more than a decade ago. V. Shulga acknowledges the College of Physics, International Center of Future Science, Jilin University, China, for hosting during the time period of preparing the paper for publication. Also, the authors are thankful to the anonymous referee for the valuable comments and suggestions.
References
- Abolmasov, P., & Shakura, N. I. 2012, MNRAS, 427, 1867 [NASA ADS] [CrossRef] [Google Scholar]
- Agol, E., Jones, B., & Blaes, O. 2000, ApJ, 545, 657 [NASA ADS] [CrossRef] [Google Scholar]
- Agol, E., Gogarten, S. M., Gorjian, V., & Kimball, A. 2009, ApJ, 697, 1010 [NASA ADS] [CrossRef] [Google Scholar]
- Anguita, T., Schmidt, R. W., Turner, E. L., et al. 2008, A&A, 480, 327 [NASA ADS] [CrossRef] [EDP Sciences] [Google Scholar]
- Assef, R. J., Denney, K. D., Kochanek, C. S., et al. 2011, ApJ, 742, 93 [NASA ADS] [CrossRef] [Google Scholar]
- Bachev, R. S. 2009, A&A, 493, 907 [NASA ADS] [CrossRef] [EDP Sciences] [Google Scholar]
- Berdina, L. A., Tsvetkova, V. S., & Shulga, V. M. 2018, Radio Phys. Radio Astron., 23, 235 [CrossRef] [Google Scholar]
- Berdina, L. A., Tsvetkova, V. S., & Shulga, V. M. 2019, Radio Phys. Radio Astron., 24, 242 [CrossRef] [Google Scholar]
- Blackburne, J., Pooley, D., Rappaport, S., & Schechter, P. L. 2011, ApJ, 729, 34 [NASA ADS] [CrossRef] [Google Scholar]
- Blandford, R. D., & McKee, C. F. 1982, ApJ, 255, 419 [Google Scholar]
- Cackett, E. M., Horne, K., & Winkler, H. 2007, MNRAS, 380, 669 [NASA ADS] [CrossRef] [Google Scholar]
- Collier, S. 2001, MNRAS, 325, 1527 [NASA ADS] [CrossRef] [Google Scholar]
- Collier, S., Horne, K., Wanders, I., & Peterson, B. M. 1999, MNRAS, 302, L24 [NASA ADS] [CrossRef] [Google Scholar]
- Collin, S., Boisson, C., Mouchet, M., et al. 2002, A&A, 388, 771 [NASA ADS] [CrossRef] [EDP Sciences] [Google Scholar]
- Cristiani, S., Trentini, S., La Franca, F., & Andreani, P. 1997, A&A, 321, 123 [NASA ADS] [Google Scholar]
- Dai, X., Chartas, G., Agol, E., Bautz, M. W., & Garmire, G. P. 2003, ApJ, 589, 100 [NASA ADS] [CrossRef] [Google Scholar]
- Dudinov, V. N., Smirnov, G. V., Vakulik, V. G., Sergeev, A. V., & Kochetov, A. E. 2011, Radio Phys. Radio Astron., 2, 115 [CrossRef] [Google Scholar]
- Edelson, R., Gelbord, J. M., Horne, K., et al. 2015, ApJ, 806, 129 [NASA ADS] [CrossRef] [Google Scholar]
- Edri, H., Rafter, S. E., Chelouche, D., Kaspi, S., & Behar, E. 2012, ApJ, 756, 73 [NASA ADS] [CrossRef] [Google Scholar]
- Eigenbrod, A., Courbin, F., Meylan, G., et al. 2008, A&A, 490, 933 [NASA ADS] [CrossRef] [EDP Sciences] [Google Scholar]
- Fausnaugh, M. M., Denney, K. D., Barth, A. J., et al. 2016, ApJ, 821, 56 [NASA ADS] [CrossRef] [Google Scholar]
- Fausnaugh, M. M., Starkey, D. A., Horne, K., et al. 2018, ApJ, 854, 107 [NASA ADS] [CrossRef] [Google Scholar]
- Frank, J., King, A., & Raine, D. 2002, Accretion Power in Astrophysics (Cambridge: Cambridge University Press), 384 [Google Scholar]
- Giveon, U., Maoz, D., Kaspi, S., Netzer, H., & Smith, P. S. 1999, MNRAS, 306, 637 [NASA ADS] [CrossRef] [Google Scholar]
- Gopal-Krishna, Joshi, R., & Chand, H. 2013, MNRAS, 430, 1302 [NASA ADS] [CrossRef] [Google Scholar]
- Grier, C. J., Trump, J. R., Shen, Y., et al. 2017, ApJ, 851, 21 [CrossRef] [Google Scholar]
- Grier, C. J., Shen, Y., Horne, K., et al. 2019, ApJ, 887, 38 [NASA ADS] [CrossRef] [Google Scholar]
- Homayouni, Y., Trump, J. R., Grier, C. J., et al. 2019, ApJ, 880, 126 [NASA ADS] [CrossRef] [Google Scholar]
- Hubeny, I., & Hubeny, V. 1998, ApJ, 505, 558 [NASA ADS] [CrossRef] [Google Scholar]
- Huchra, J., Gorenstein, M., Kent, S., et al. 1985, AJ, 90, 691 [NASA ADS] [CrossRef] [Google Scholar]
- Jaroszynski, M., Wambsganss, J., & Paczynski, B. 1992, ApJ, 396, L65 [NASA ADS] [CrossRef] [Google Scholar]
- Jiang, L., Shen, Y., McGreer, I. D., et al. 2016, ApJ, 818, 137 [CrossRef] [Google Scholar]
- Jiang, Y.-F., Stone, J. M., & Davis, S. W. 2019, ApJ, 880, 67 [NASA ADS] [CrossRef] [Google Scholar]
- Jin, C., Done, C., & Ward, M. 2017, MNRAS, 468, 3663 [NASA ADS] [CrossRef] [Google Scholar]
- Kaspi, Sh., Smith, P. S., Netzer, H., et al. 2000, ApJ, 533, 631 [NASA ADS] [CrossRef] [Google Scholar]
- Kelly, B. C., Bechtold, J., Trump, J. R., Vestergaard, M., & Siemiginowska, A. 2008, ApJS, 176, 355 [NASA ADS] [CrossRef] [Google Scholar]
- Kinemuchi, K., Hall, P. B., McGreer, I., et al. 2020, ApJ, 250, 10 [Google Scholar]
- Kochanek, C. S. 2004, ApJ, 605, 58 [Google Scholar]
- Kokubo, M. 2018, PASJ, 70, 97 [NASA ADS] [CrossRef] [Google Scholar]
- Kokubo, M., & Minezaki, T. 2020, MNRAS, 491, 4615 [CrossRef] [Google Scholar]
- Kollmeier, J. A., Onken, C. A., Kochanek, C. S., et al. 2006, ApJ, 648, 128 [NASA ADS] [CrossRef] [Google Scholar]
- Koptelova, E., Shimanovskaya, E., Artamonov, B., et al. 2005, MNRAS, 356, 323 [NASA ADS] [CrossRef] [Google Scholar]
- Koptelova, E. A., Oknyanskij, V. L., & Shimanovskaya, E. V. 2006, A&A, 452, 37 [NASA ADS] [CrossRef] [EDP Sciences] [Google Scholar]
- Koptelova, E. A., Oknyanskij, V. L., Artamonov, B., & Chen, W.-P. 2010, Mem. Soc. Astron. It., 81, 138 [Google Scholar]
- Krolik, J. H., Horne, K., Kallman, T. R., et al. 1991, ApJ, 371, 541 [NASA ADS] [CrossRef] [Google Scholar]
- Kumar, P., Gopal-Krishna, & Chand, H. 2015, MNRAS, 448, 1463 [CrossRef] [Google Scholar]
- Lanzuisi, G., Perna, M., Comastri, A., et al. 2016, A&A, 590, A77 [NASA ADS] [CrossRef] [EDP Sciences] [Google Scholar]
- Liu, H., Luo, B., Brandt, W. N., et al. 2019, ApJ, 878, 79 [CrossRef] [Google Scholar]
- Luo, Y., Shen, Y., & Yang, Q. 2020, MNRAS, 494, 3686 [CrossRef] [Google Scholar]
- Magdis, G., & Papadakis, I. E. 2006, ASP Conf. Ser., 360, 37 [Google Scholar]
- Mediavilla, E., Jimenez-vicente, J., Munoz, J. A., & Mediavilla, T. 2015a, ApJ, 814, 26 [NASA ADS] [CrossRef] [Google Scholar]
- Mediavilla, E., Jimenez-Vicente, J., Munoz, J. A., Mediavilla, T., & Ariza, O. 2015b, ApJ, 798, 138 [NASA ADS] [CrossRef] [Google Scholar]
- Morgan, C. W., Kochanek, C. S., Morgan, N. D., & Falco, E. E. 2010, ApJ, 712, 1129 [NASA ADS] [CrossRef] [Google Scholar]
- Mosquera, A. M., Kochanek, C. S., Chen, B., et al. 2013, ApJ, 769, 53 [NASA ADS] [CrossRef] [Google Scholar]
- Mudd, D., Martini, P., Zu, Y., et al. 2018, ApJ, 862, 123 [NASA ADS] [CrossRef] [Google Scholar]
- Munoz, J. A., Vives-Arias, H., Mosquera, A. M., et al. 2016, ApJ, 817, 155 [NASA ADS] [CrossRef] [Google Scholar]
- Ohsuga, K., Mori, M., Nakamoto, T., & Mineshige, S. 2005, ApJ, 628, 368 [NASA ADS] [CrossRef] [Google Scholar]
- Okuda, T., Teresi, V., Toscano, E., & Molteni, D. 2005, MNRAS, 357, 295 [NASA ADS] [CrossRef] [Google Scholar]
- Pinto, C., Mehdipour, M., Walton, D. J., et al. 2020, MNRAS, 491, 5702 [CrossRef] [Google Scholar]
- Poindexter, S., & Kochanek, C. S. 2010, ApJ, 712, 668 [NASA ADS] [CrossRef] [Google Scholar]
- Poindexter, S., Morgan, N., & Kochanek, C. S. 2008, ApJ, 673, 34 [NASA ADS] [CrossRef] [Google Scholar]
- Pooley, D., Blackburne, J. A., Rappaport, S., & Schechter, P. L. 2007, ApJ, 661, 19 [NASA ADS] [CrossRef] [Google Scholar]
- Sakurai, Y., Inayoshi, K., & Haiman, Z. 2016, MNRAS, 461, 4496 [CrossRef] [Google Scholar]
- Schmidt, K. B., Rix, H.-W., Shields, J. C., et al. 2012, ApJ, 744, 147 [NASA ADS] [CrossRef] [Google Scholar]
- Sergeev, S. G., Doroshenko, V. T., Golubinskiy, Y. V., Merkulova, N. I., & Sergeeva, E. A. 2005, ApJ, 622, 129 [NASA ADS] [CrossRef] [Google Scholar]
- Shakura, N. 2018, Accretion Flows in Astrophysics (Springer), 419 [Google Scholar]
- Shakura, N. I., & Sunyaev, R. A. 1973, A&A, 24, 337 [NASA ADS] [Google Scholar]
- Schild, R., & Vakulik, V. 2003, AJ, 126, 689 [NASA ADS] [CrossRef] [Google Scholar]
- Shulga, V. M., Minakov, A. A., Vakulik, V. G., Smirnov, G. V., & Tsvetkova, V. S. 2014, in Dark Matter: Astrophysical Aspects of the Problem, ed. V. Shulga, 2, 357 [Google Scholar]
- Sluse, D., Schmidt, R., Courbin, F., et al. 2011, A&A, 528, 100 [NASA ADS] [CrossRef] [EDP Sciences] [Google Scholar]
- Tewes, M., Courbin, F., & Meylan, G. 2013, A&A, 553, A120 [NASA ADS] [CrossRef] [EDP Sciences] [Google Scholar]
- Tsvetkova, V. S., Shulga, V. M., & Berdina, L. A. 2016, MNRAS, 461, 3714 [NASA ADS] [CrossRef] [Google Scholar]
- Udalski, A., Szymanski, M. K., Kubiak, M., et al. 2006, Acta Astron., 56, 293 [Google Scholar]
- Vakulik, V. G., Schild, R. E., Dudinov, V. N., et al. 2004, A&A, 420, 447 [NASA ADS] [CrossRef] [EDP Sciences] [Google Scholar]
- Vakulik, V. G., Schild, R. E., Smirnov, G. V., Dudinov, V. N., & Tsvetkova, V. S. 2007, MNRAS, 382, 819 [CrossRef] [Google Scholar]
- Vanden Berk, D. E., Wilhite, B. C., Kron, R. G., et al. 2004, ApJ, 601, 692 [NASA ADS] [CrossRef] [Google Scholar]
- Vives-Arias, H., Munoz, J. A., Kochanek, C. S., Mediavilla, E., & Jiménez-Vicente, J. 2016, ApJ, 831, 43 [NASA ADS] [CrossRef] [Google Scholar]
- Volonteri, M., Silk, J., & Dubus, G. 2015, ApJ, 804, 148 [NASA ADS] [CrossRef] [Google Scholar]
- Wanders, I., Peterson, B. M., Alloin, D., et al. 1997, ApJS, 113, 69 [NASA ADS] [CrossRef] [Google Scholar]
- Wayth, R. B., O’Dowd, M., & Webster, R. L. 2005, MNRAS, 359, 561 [NASA ADS] [CrossRef] [Google Scholar]
- Webb, W., & Malkan, M. 2000, ApJ, 540, 652 [NASA ADS] [CrossRef] [Google Scholar]
- Wilhite, B. C., Vanden Berk, D. E., Kron, R. G., et al. 2005, ApJ, 633, 638 [NASA ADS] [CrossRef] [Google Scholar]
- Witt, H. J., & Mao, S. 1994, ApJ, 429, 66 [NASA ADS] [CrossRef] [Google Scholar]
- Yee, H. K. C., & De Robertis, M. M. 1991, ApJ, 381, 386 [NASA ADS] [CrossRef] [Google Scholar]
- Yi, W., Brandt, W. N., Hall, P. B., et al. 2019, ApJ, 242, 28 [Google Scholar]
- Yu, Z., Martini, P., Davis, T. M., et al. 2020, ApJ, 246, 16 [Google Scholar]
All Tables
General information about the data of observations of Q2237+0305 used to determine the interband time delays in this work.
Relative interband time lags τ (in days) of the Q2237+0305 quasar for the RV, IR, and IV pairs of light curves from the monitoring data by Dudinov et al. (2011) (in the observers’s coordinate system).
Rest-frame time delays of the Q2237+0305 quasar for the RV, IR, and IV pairs of light curves averaged over the three components, and the corresponding confidence intervals CI for the 80% confidence level.
Estimates of the black hole mass in the Q2237+0305 quasar collected from the works published during 2000−2015.
Half-light radius r1/2 of the Q2237+0305 quasar accretion disk determined in different works from the analysis of microlensing events.
All Figures
|
Fig. 1. Light curves of Q2237+0305 in filters V, R, and I from observations by Dudinov et al. (2011). The data for the seasons in 2004 and 2005 are presented. |
| In the text | |
|
Fig. 2. Polynomial approximations for the light curves in Fig. 1: the curves are reduced to the same magnitude level, and the first-order terms are eliminated (Δm is the brightness variations in magnitude relative to the average level for a given season). |
| In the text | |
|
Fig. 3. Histograms of the probability density distribution P for the estimates of the interband time delays τRV, τIR, and τIV presented in Table 2. |
| In the text | |
|
Fig. 4. Difference maps between the interband time delays determined in the present work and calculated according to Eqs. (2) and (10). The brightest regions correspond to the smallest difference between these values. The maps are built for three black hole masses, from top to bottom: MBH = 2 × 10⁸ M⊙, MBH = 9 × 10⁸ M⊙, and MBH = 20 × 108 M⊙. |
| In the text | |
Current usage metrics show cumulative count of Article Views (full-text article views including HTML views, PDF and ePub downloads, according to the available data) and Abstracts Views on Vision4Press platform.
Data correspond to usage on the plateform after 2015. The current usage metrics is available 48-96 hours after online publication and is updated daily on week days.
Initial download of the metrics may take a while.