Fig. 4.
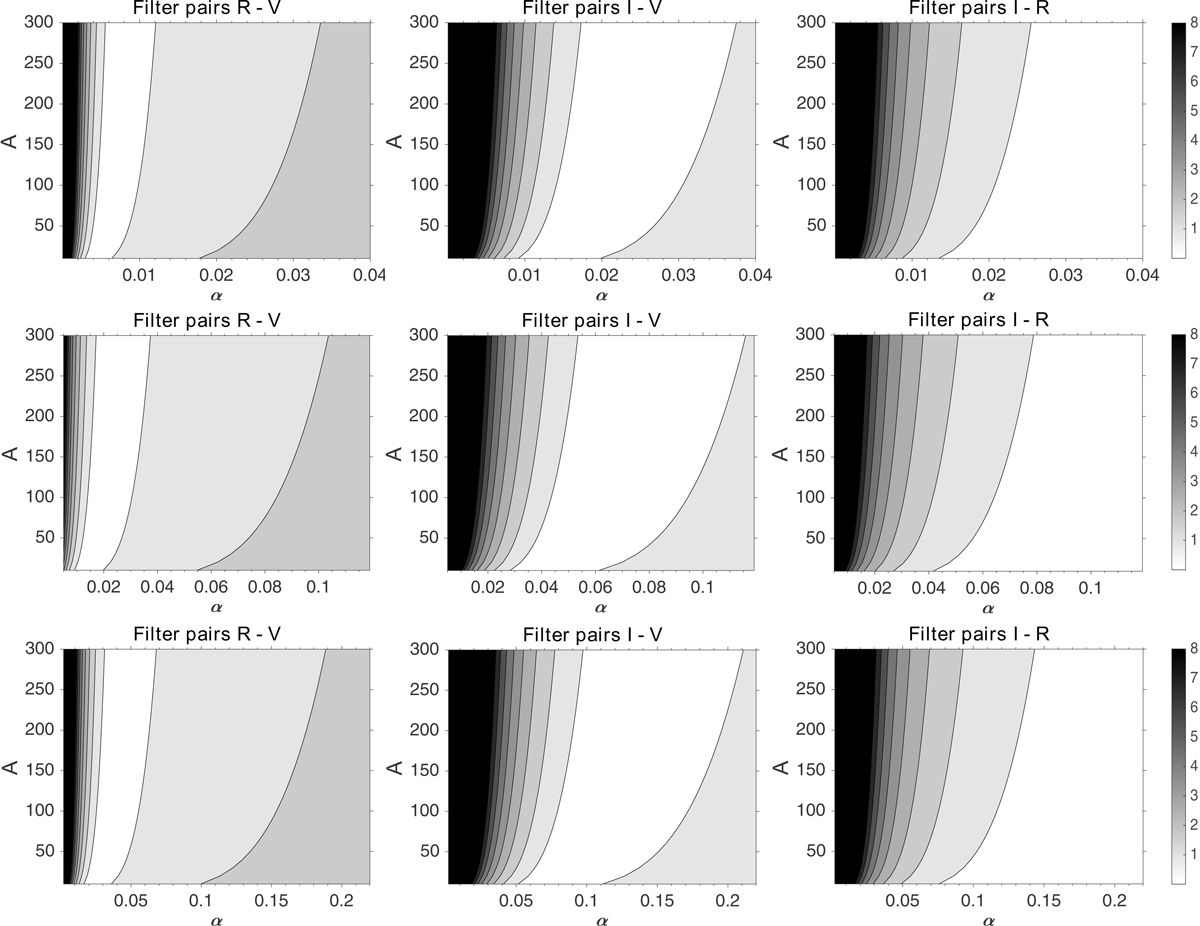
Difference maps between the interband time delays determined in the present work and calculated according to Eqs. (2) and (10). The brightest regions correspond to the smallest difference between these values. The maps are built for three black hole masses, from top to bottom: MBH = 2 × 10⁸ M⊙, MBH = 9 × 10⁸ M⊙, and MBH = 20 × 108 M⊙.
Current usage metrics show cumulative count of Article Views (full-text article views including HTML views, PDF and ePub downloads, according to the available data) and Abstracts Views on Vision4Press platform.
Data correspond to usage on the plateform after 2015. The current usage metrics is available 48-96 hours after online publication and is updated daily on week days.
Initial download of the metrics may take a while.