Free Access
Fig. 2.
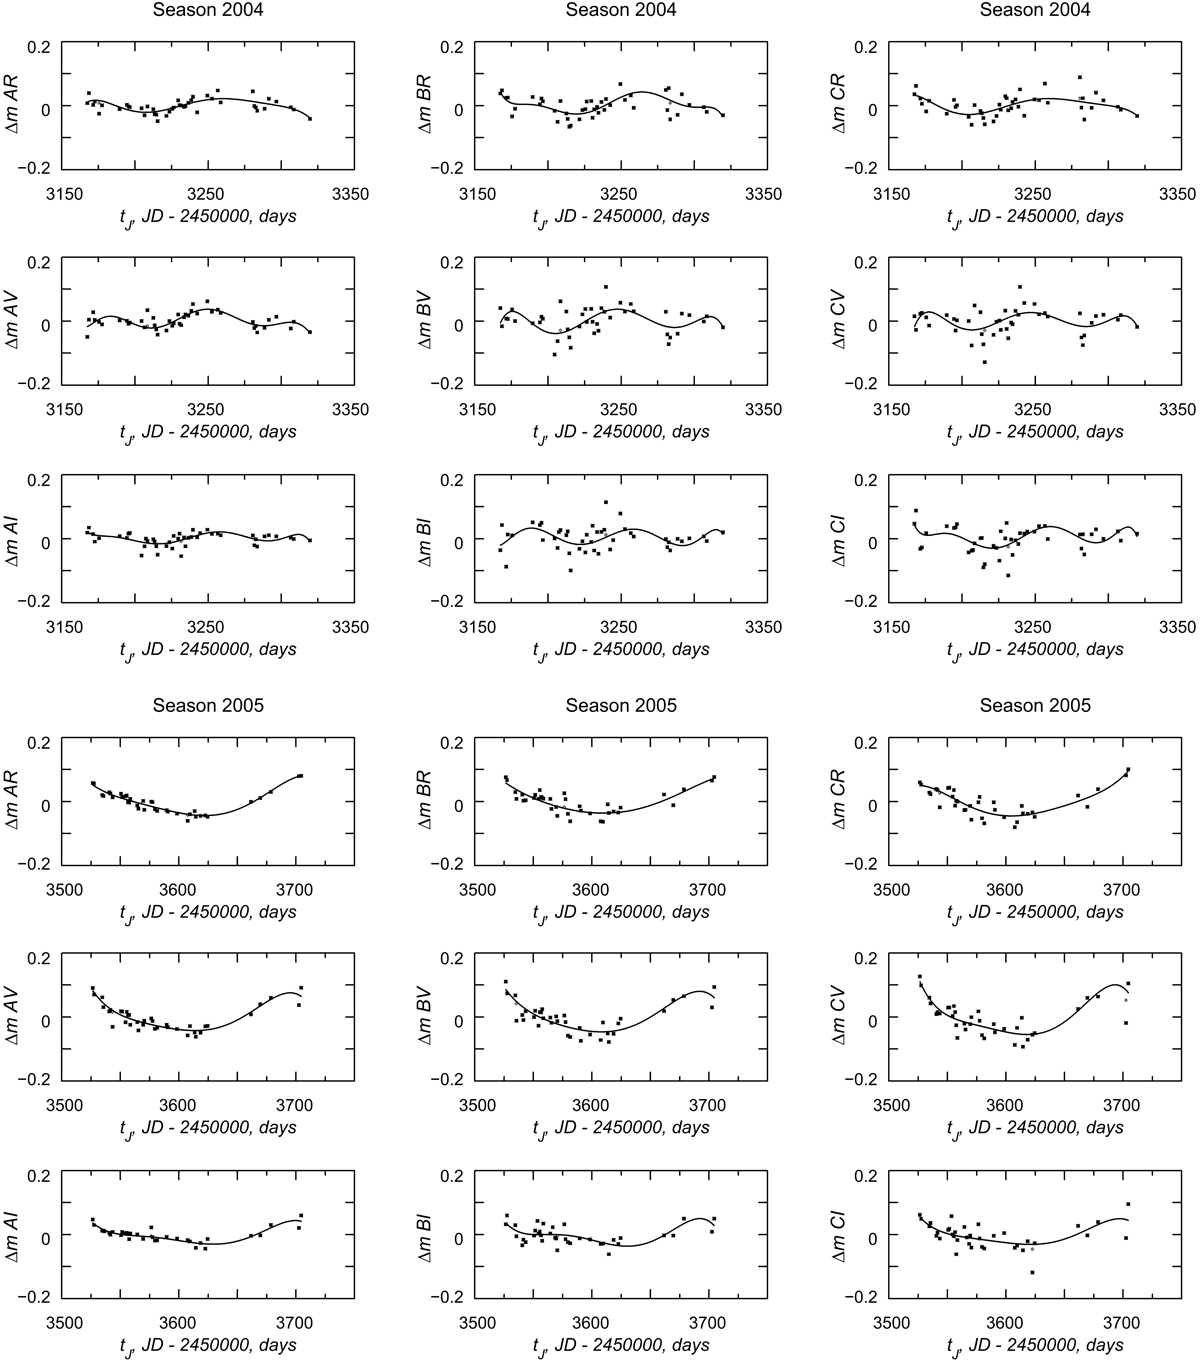
Polynomial approximations for the light curves in Fig. 1: the curves are reduced to the same magnitude level, and the first-order terms are eliminated (Δm is the brightness variations in magnitude relative to the average level for a given season).
Current usage metrics show cumulative count of Article Views (full-text article views including HTML views, PDF and ePub downloads, according to the available data) and Abstracts Views on Vision4Press platform.
Data correspond to usage on the plateform after 2015. The current usage metrics is available 48-96 hours after online publication and is updated daily on week days.
Initial download of the metrics may take a while.