Fig. 9.
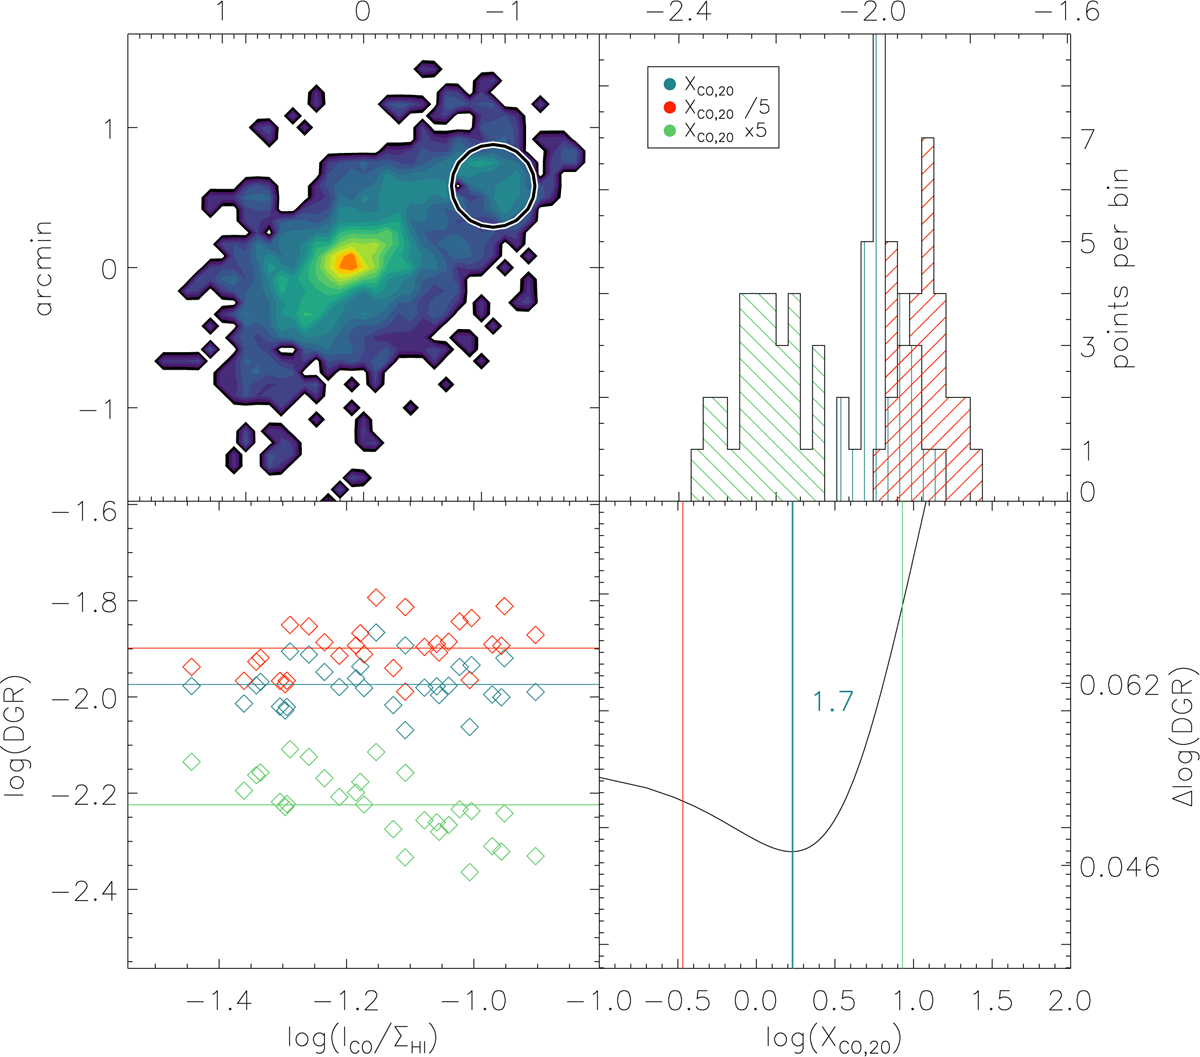
Simultaneous determination of the dust-to-gas ratio and the CO-to-H2 conversion factor based on method described in Sandstrom et al. (2013). Top-left panel: selected region for the study on the CO(2−1) map. Top-right panel: scatter of the DGR calculated within resolution elements inside the selected area for different XCO. Bottom-left panel: standard deviation of the DGR as a function of the ration between the CO(2−1) flux and the HI gas surface density. Bottom-right panel: DGR dispersion as a function of XCO.
Current usage metrics show cumulative count of Article Views (full-text article views including HTML views, PDF and ePub downloads, according to the available data) and Abstracts Views on Vision4Press platform.
Data correspond to usage on the plateform after 2015. The current usage metrics is available 48-96 hours after online publication and is updated daily on week days.
Initial download of the metrics may take a while.