Fig. 28.
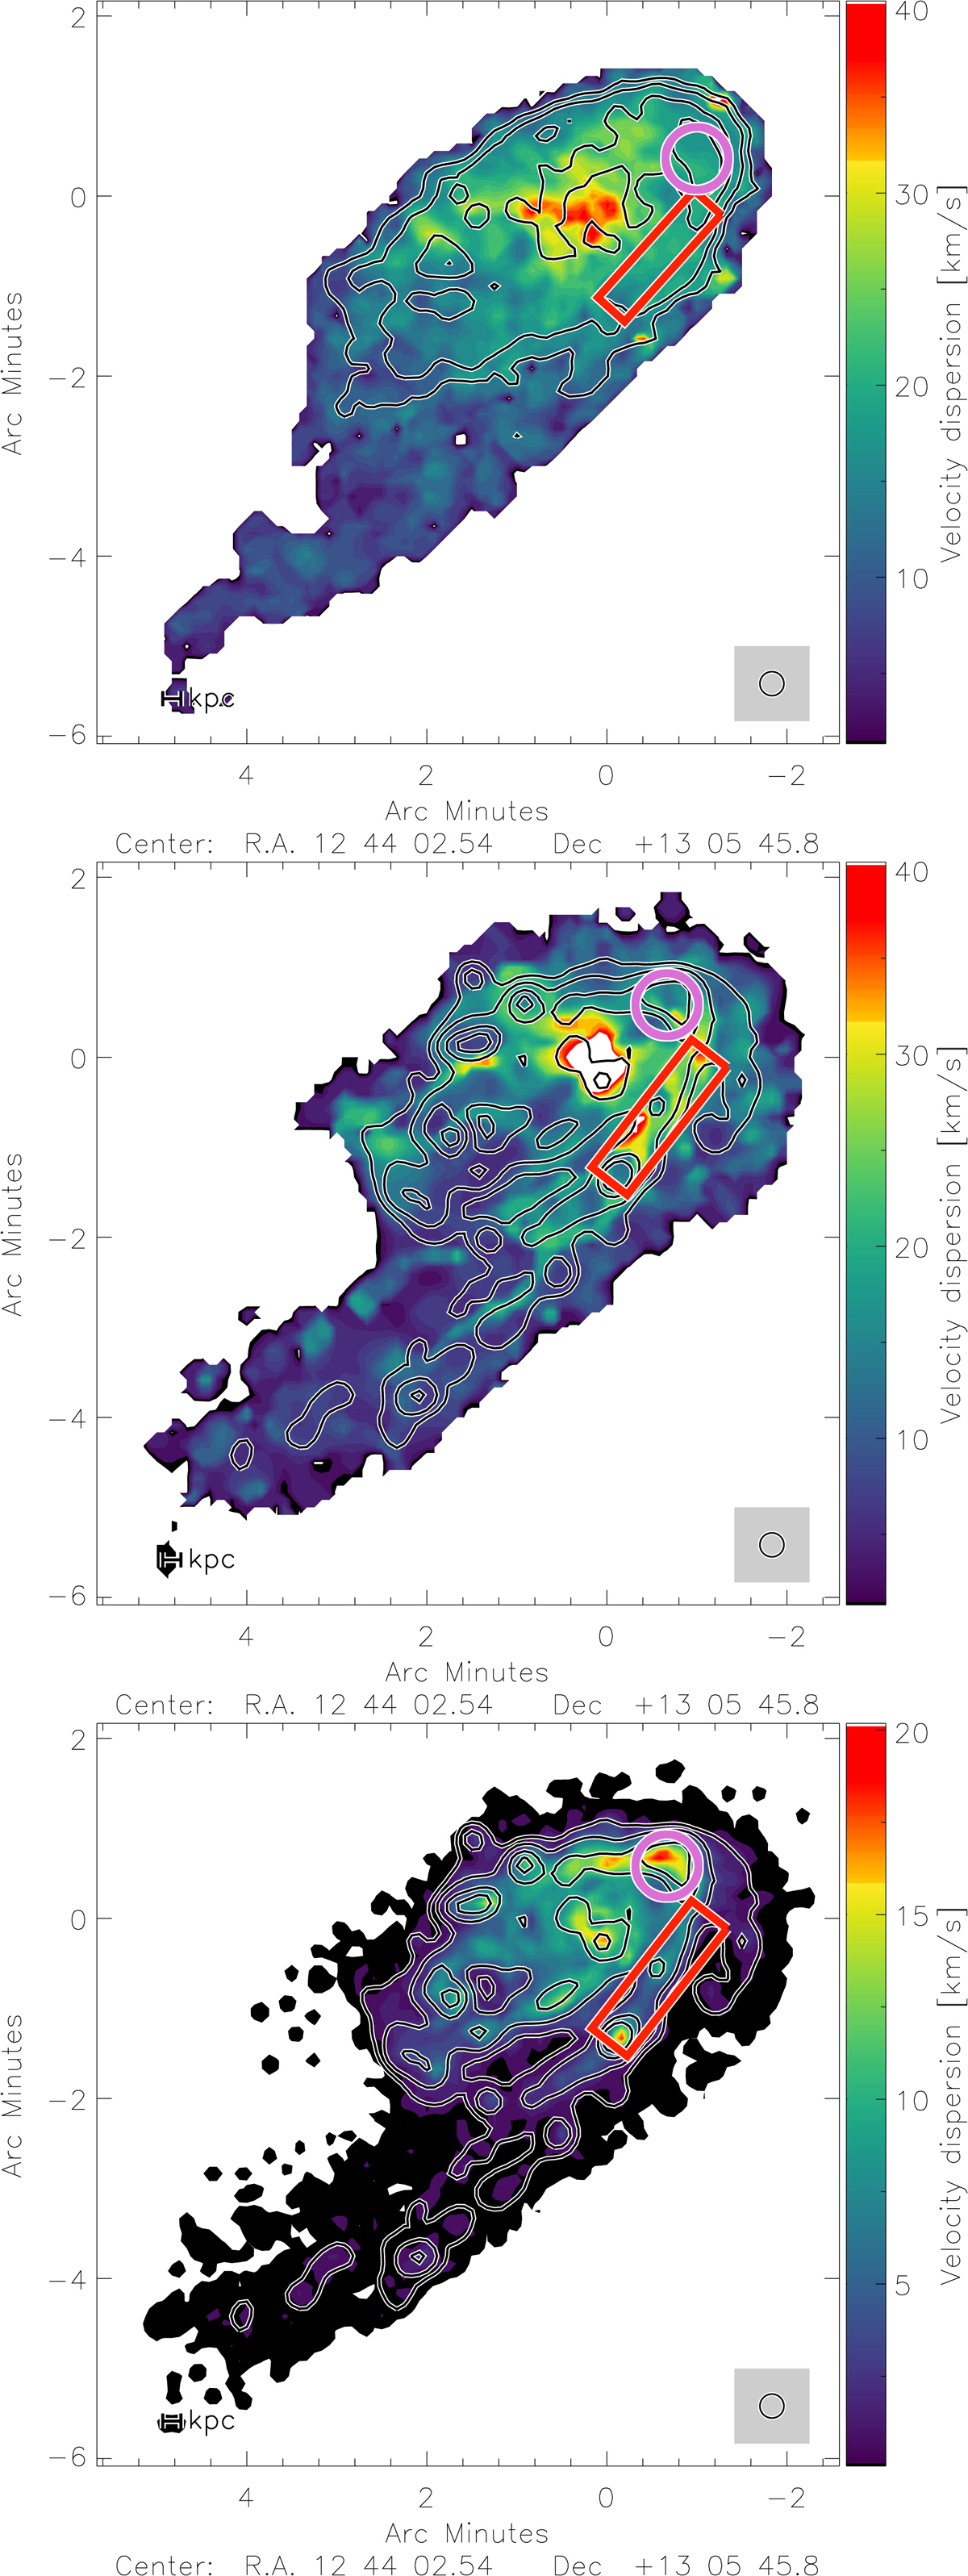
Gas velocity dispersion. Top panel: observed VIVA H I velocity dispersion (moment 2). Middle panel: velocity dispersion (moment 2) of the dynamical model. Bottom panel: intrinsic 3D velocity dispersion. The pink circle corresponds to the high H I surface density region. The red rectangle corresponds to the external gas arm. Contours correspond to H I surface densities of ΣHI = 5, 10, 20 and 50 M⊙ pc−2.
Current usage metrics show cumulative count of Article Views (full-text article views including HTML views, PDF and ePub downloads, according to the available data) and Abstracts Views on Vision4Press platform.
Data correspond to usage on the plateform after 2015. The current usage metrics is available 48-96 hours after online publication and is updated daily on week days.
Initial download of the metrics may take a while.